Showing posts with label data. Show all posts
Showing posts with label data. Show all posts
Wednesday, February 18, 2015
Kettle Pass parameters from job to transformation in PDI Retrieve data from table by passing table name as parameter
This post will talk about basic understanding of parameters concept in PDI.
Software Setup :
PDI 5.1.0 CE
PostgreSQL
Concept : Retrieve data from table by passing table name as parameter.
You will learn below things
1) Table input step & database connections
2) Creating parameter(s) in Transformation(s) & Job(s)
3) Passing parameter(s) from job to transformation.
Lets say in foodmart database you have below tables 1) region 2) product 3) customer and etc.
Every time when you pass different table name as parameter you should able to fetch the data coming from the passed table.
1) Table input step & database connections
2) Creating parameter(s) in Transformation(s) & Job(s)
1) Create a new transformation & drag and drop "Table Input" step from Design Pane.

2) Double Click on "Table input" step & Click on New tab to give database connections as shown in below image

3) Define the parameter in transformation ( in this example the table name should go as parameter).
Image A : Right Click on the empty space to get the transformation settings.
Image B : Database Connection Details
Parameter Name is : tableName


4) Come back to the properties of "Table input" & write select statement to retrieve the data.
Eg : SELECT * FROM product LIMIT 100
In above example "product" is the table name that you have to replace with the parameter.
i.e., SELECT * FROM ${tableName} LIMIT 100
Once you write the query, come down check "Replace variables in script"

5) Take a "Dummy" step and connect it to "Table input step" . Save the transformation & run it on "Dummy Step"( Right click dummy step and click on "Preview".
OUTPUT : Test 1 : With "region" table

OUTPUT : Result 1

OUTPUT : Test 2 : With "product" table
* Right click Dummy step then click on Preview
* Click on Configure & then in parameters tab give "product" for tableName value parameter.
OUTPUT : Result 2

3) Passing parameter(s) from job to transformation
* Crtl+Alt to create a new job
* From the "General" node of Design tab ( Appears left side) drag and drop "Transoformation step".
* Drag and drop "START" step and connect these two as shown in below image.

* Double click on "Transformation" step to set the properties & parameter information.
* Browse for the transformation file and then move to parameters tab
* Click on "Get Parameters" then you can find parameter get apper under Parameter tab.
* Right click on empty canvas of job to get its settings & move to Parameters tab and give parameter name as "tableName" and provide default value.
Save the job and run it.
IMP NOTE :
1) Parameter names in job & transformation should match.
2) You can create n number of parameters in job but can pass as many you wish.
3) In job design you should take "START" step to tell the job to start execution from there.
If you ignore you will get below error ( which took me awhile to solve it for the very first time).
Start of job execution
:A serious error occurred during job execution:
Couldnt find starting point in this job.
org.pentaho.di.core.exception.KettleJobException:
Couldnt find starting point in this job.
at org.pentaho.di.job.Job.execute(Job.java:516)
at org.pentaho.di.job.Job.run(Job.java:422)
Spoon - Job has ended.
References :
1) http://wiki.pentaho.com/display/EAI/Named+Parameters
2) http://diethardsteiner.blogspot.in/2013/07/pentaho-kettle-parameters-and-variables.html
3) http://wiki.pentaho.com/display/EAI/Substituting+variable+references+in+Job+Parameter+values
Hope this helps some one like me for the first time who is looking for parameters(named) concept :-)
Cheers :-)
:-) Happy New Year - Welcome - 2015 :-)
Software Setup :
PDI 5.1.0 CE
PostgreSQL
Concept : Retrieve data from table by passing table name as parameter.
You will learn below things
1) Table input step & database connections
2) Creating parameter(s) in Transformation(s) & Job(s)
3) Passing parameter(s) from job to transformation.
Lets say in foodmart database you have below tables 1) region 2) product 3) customer and etc.
Every time when you pass different table name as parameter you should able to fetch the data coming from the passed table.
1) Table input step & database connections
2) Creating parameter(s) in Transformation(s) & Job(s)
1) Create a new transformation & drag and drop "Table Input" step from Design Pane.
2) Double Click on "Table input" step & Click on New tab to give database connections as shown in below image
3) Define the parameter in transformation ( in this example the table name should go as parameter).
Image A : Right Click on the empty space to get the transformation settings.
Image B : Database Connection Details
Parameter Name is : tableName
4) Come back to the properties of "Table input" & write select statement to retrieve the data.
Eg : SELECT * FROM product LIMIT 100
In above example "product" is the table name that you have to replace with the parameter.
i.e., SELECT * FROM ${tableName} LIMIT 100
Once you write the query, come down check "Replace variables in script"
5) Take a "Dummy" step and connect it to "Table input step" . Save the transformation & run it on "Dummy Step"( Right click dummy step and click on "Preview".
OUTPUT : Test 1 : With "region" table
OUTPUT : Result 1
OUTPUT : Test 2 : With "product" table
* Right click Dummy step then click on Preview
* Click on Configure & then in parameters tab give "product" for tableName value parameter.
OUTPUT : Result 2
3) Passing parameter(s) from job to transformation
* Crtl+Alt to create a new job
* From the "General" node of Design tab ( Appears left side) drag and drop "Transoformation step".
* Drag and drop "START" step and connect these two as shown in below image.
* Double click on "Transformation" step to set the properties & parameter information.
* Browse for the transformation file and then move to parameters tab
* Click on "Get Parameters" then you can find parameter get apper under Parameter tab.
* Right click on empty canvas of job to get its settings & move to Parameters tab and give parameter name as "tableName" and provide default value.
Save the job and run it.
IMP NOTE :
1) Parameter names in job & transformation should match.
2) You can create n number of parameters in job but can pass as many you wish.
3) In job design you should take "START" step to tell the job to start execution from there.
If you ignore you will get below error ( which took me awhile to solve it for the very first time).
Start of job execution
:A serious error occurred during job execution:
Couldnt find starting point in this job.
org.pentaho.di.core.exception.KettleJobException:
Couldnt find starting point in this job.
at org.pentaho.di.job.Job.execute(Job.java:516)
at org.pentaho.di.job.Job.run(Job.java:422)
Spoon - Job has ended.
References :
1) http://wiki.pentaho.com/display/EAI/Named+Parameters
2) http://diethardsteiner.blogspot.in/2013/07/pentaho-kettle-parameters-and-variables.html
3) http://wiki.pentaho.com/display/EAI/Substituting+variable+references+in+Job+Parameter+values
Hope this helps some one like me for the first time who is looking for parameters(named) concept :-)
Cheers :-)
:-) Happy New Year - Welcome - 2015 :-)

Skip List Data Structure
A skip list is a data structure that is used for storing a sorted list of items with a help of hierarchy of linked lists that connect increasingly sparse subsequences of the items. A skip list allows the process of item look up in efficient manner. The skip list data structure skips over many of the items of the full list in one step, that’s why it is known as skip list.
 |
| Skip List |
Complexity
| | Average Case | Worst Case |
| Space | O(n) | O(nlogn) |
| Search | O(logn) | O(n) |
| Insert | O(logn) | O(n) |
| Delete | O(logn) | O(n) |
Structure of Skip List
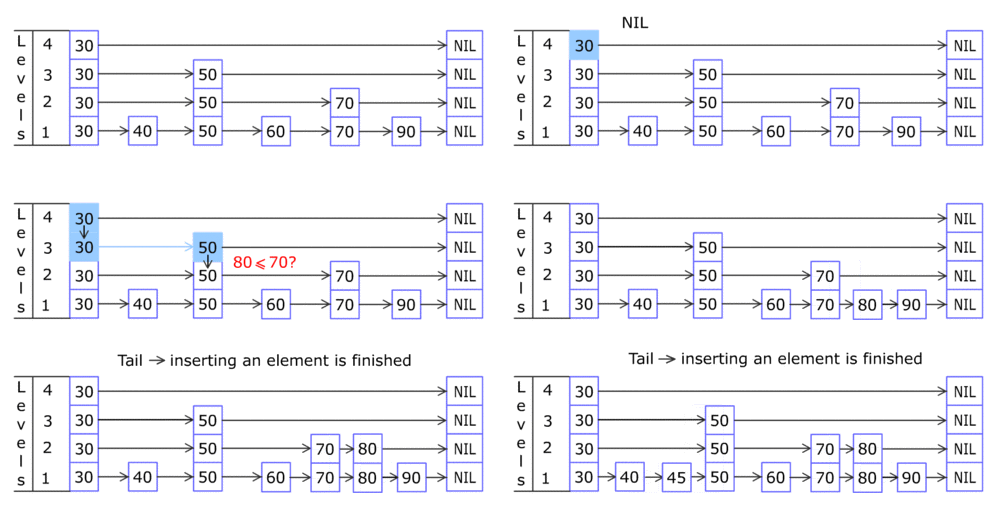
A skip list is built up of layers. The lowest layer (i.e. bottom layer) is an ordinary ordered linked list. The higher layers are like ‘express lane’ where the nodes are skipped (observe the figure).
Searching Process
When an element is tried to search, the search begins at the head element of the top list. It proceeds horizontally until the current element is greater than or equal to the target. If current element and target are matched, it means they are equal and search gets finished.
If the current element is greater than target, the search goes on and reaches to the end of the linked list, the procedure is repeated after returning to the previous element and the search reaches to the next lower list (vertically).
Implementation Details
1. The elements used for a skip list can contain more than one pointers since they are allowed to participated in more than one list.
2. Insertion and deletion operations are very similar to corresponding linked list operations.
 |
| Insertion in Skip List |
Applications of Skip List
1. Skip list are used in distributed applications. In distributed systems, the nodes of skip list represents the computer systems and pointers represent network connection.
2. Skip list are used for implementing highly scalable concurrent priority queues with less lock contention (struggle for having a lock on a data item).
Sunday, February 15, 2015
Migrating data from Oracle database to Postgresql database using Pentaho Kettle
This post will talk about migrating data from Oracle database to Postgresql database.
The same can be doable from one database to another database.(i.e., for example MS-SQL server to postgreSQL).
Pentaho has its in built wizard tools to Migrate data from one database to another another database.
Find the below steps how we can use this in-buit tool in migrating.
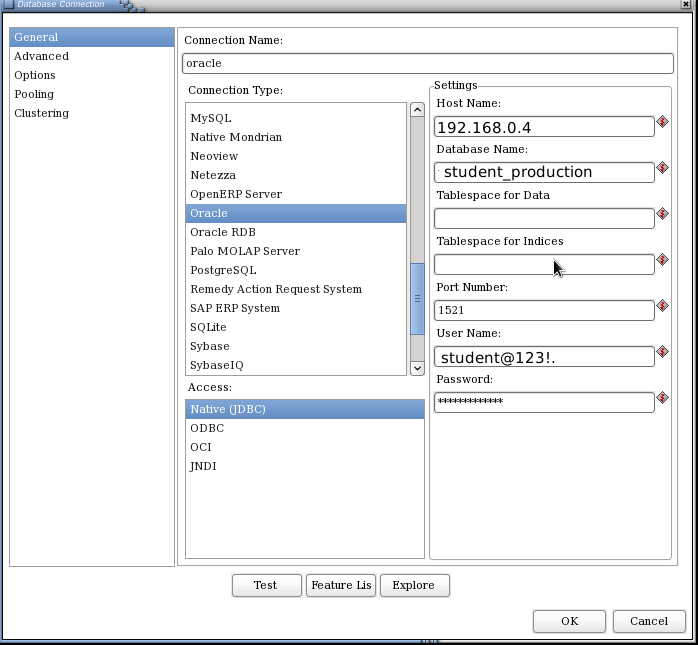
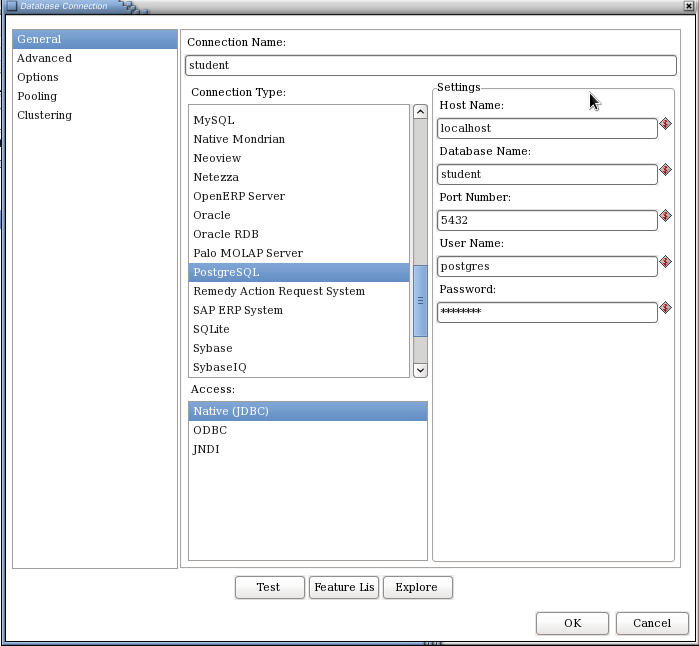
1) Create source database connection and target database connection.
i.e., for example oralce connection as source and postgresql connection as target.
Go to Tools -> Wizard -> Create database connection.
Repeat the same for postgresql connection.
2) Go to Tools -> Wizard ->Copy Tables . Find the below images.
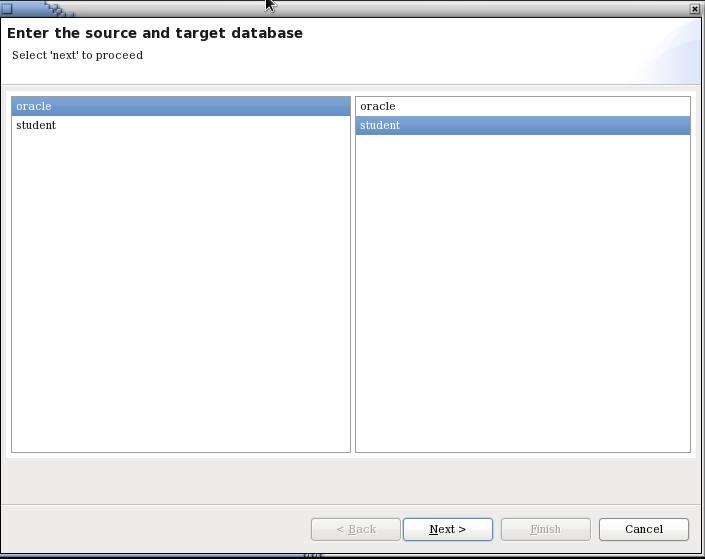
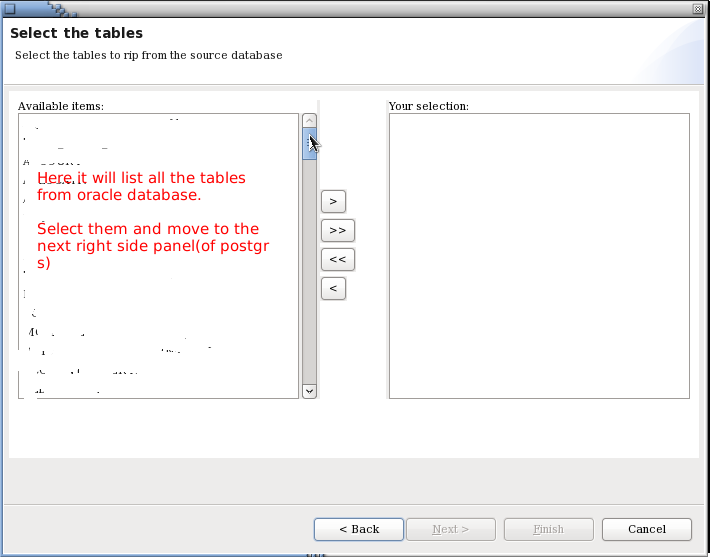
3) Itll create a job and “N” number of transformations based upon the number of tables in oracle database.
4) Run your job.. Thats all we have done.
Check the description & content of the tables in postgres.
References :
https://wiki.postgresql.org/wiki/Migrating_from_one_database_to_another_with_Pentaho_ETL
http://wiki.pentaho.com/display/COM/Using+the+Copy+Table+Wizard
http://wiki.pentaho.com/display/COM/Using+the+Copy+Table+Wizard
What is Disjoint set Data Structure
It is a data structure to keep a record of set of elements that are partitioned into number of disjoint subsets.
Such type of data structure performs three basic operations:
1. MakeSet operation
2. Find operation
3. Union operation
1. MakeSet operation
2. Find operation
3. Union operation
Sometimes, it is called Union-Find data structure or Merge-Find data structure.
Applications
Applications
It is used as an auxiliary data structure for various algorithms like Kruskal’s algorithm in graph theory and other partitioning problems.
Also Read: C Program for Tower of Hanoi Problem
Also Read: C Program for Sorting an Array using Heap Sort
Also Read: C Program for Tower of Hanoi Problem
Also Read: C Program for Sorting an Array using Heap Sort
MakeSet Operation
Initially, input elements are considered as a collection of n sets, of which each element in each set. Each set has different element, so Si ∩ Sj = Φ. This makes sets disjoints.The operation MakeSet creates a new set containing a single element for each given element. MakeSet creates a set of singleton elements in which each element represent its own set as shown below.

Union and Find Operation
To add relation, aRb (a and b can be any element from given elements) we use Union operation. But to do union we have to find out that whether a and b are related or not.
This can be verified by Find operation. Find operation check whether a and b are already related or not. If they are not, then union is applied creating a new set Sk = Si U Sj and deletes Si and Sj. If they are related, Find returns the set in which they are located.
Eg: After some operations of union, some sets are grouped together as shown below:

To represent each set, which is important, an element is fixed which is called representative of that set. So, while we are using Find operation on any element X, it will return the representative of the set in which element X is present.
For better understanding watch below video:
In next tutorial we will be discussing about implementations of disjoint-set data structure.
Author Bio:
Manisha Khandelwal is a computer science engineering student who lives in India. Data Structure is one of her favorite subjects. You can find her on Facebook at http://www.facebook.com/mannkhandelwal or contact her on Gmail at manishakhandelwal2611@gmail.com.
For better understanding watch below video:
In next tutorial we will be discussing about implementations of disjoint-set data structure.
Author Bio:
Manisha Khandelwal is a computer science engineering student who lives in India. Data Structure is one of her favorite subjects. You can find her on Facebook at http://www.facebook.com/mannkhandelwal or contact her on Gmail at manishakhandelwal2611@gmail.com.
Tuesday, February 10, 2015
Kettle transformation as data source in Pentaho CDE OR Excel sheet as data source for pentaho CDE dashboard
Hello Guys..
Scenario :
If you receive excel sheet or csv file as data source then how to create dashboard charts or tables in pentaho CDE ?
Like jasper here we do not have any direct way to connect excel sheet as a data source. Here in Pentaho suite we need to make use of Kettle(PDI) to work out with Excel or CSV data sources.
Current post is an example of using Excel data source for Pentaho CDE dashboard.
This post is not using any parameters(Need to work out with parameters and update this blog post).
Aim of the Example:
Creating dashboard charts using Excel Datasheet
Environment :
1) PDI(Kettlle)- 4.4 stable
2) Pentaho BA server - 4.8 stable
3) Excel data source(with .xls extension)
4) Pentaho C-Tools(13.09 version)
5) Web browser(Mozilla is preferable)
Example :
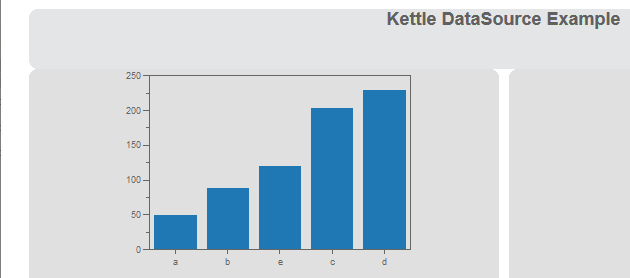
Displaying bar chart group by summation of ranks in ascending order. (just an example data sheet)
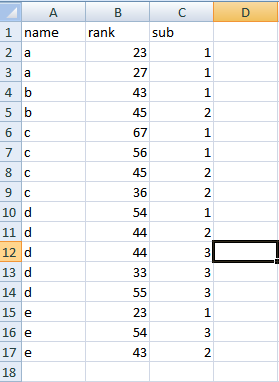
Display names on X-axis and summation of ranks on Y-axis on Pentaho CDE chart...
Data display should be grouped by name .
Data display should be grouped by name .
NOTE:
Save your kettle file in the folder where you also saving the CDE files.
i.e., Generally in 4.8 BA server
under pentaho-solutions/your project(dashboard) folder. Bz you need to pick the developed .ktr file from data sources section.
Steps:1 Working with PDI for Excel Data
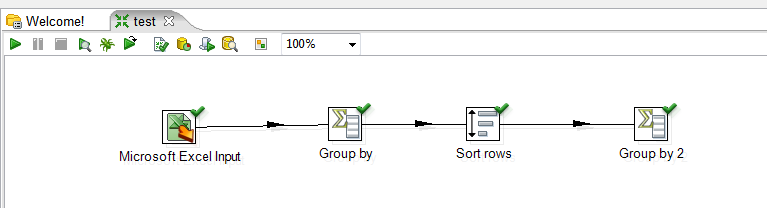
1) Drag an drop Excel Input step.
Design-> Input -> Microsoft Excel Input ->
2) Double click on Microsoft Excel Input step and Browse for your excel file and then Add.
3) Drag and drop "Group By" step from Design->Statistics
Double click on it and select Group field as name
In the aggregates select as below
Name Subject Type Value
name rank Sum
4) Connect the two Steps( i.e., connect "Microsoft Excel Input" and "Group By" with an Hop.
5) See the preview (Use Debug this transformation).
6) Sort the output that you got from step 5.
Drag and drop "Sort rows" step from Design ->Transform.
connect "Group By" step to "Sort rows" step using a hop.
7) After sorting add another step say "Group By 2" to your transformation and now see the preview of the transformation.
Kettle Design Image:
Down load source code of this example here
References :
1) Drag an drop Excel Input step.
Design-> Input -> Microsoft Excel Input ->
2) Double click on Microsoft Excel Input step and Browse for your excel file and then Add.
3) Drag and drop "Group By" step from Design->Statistics
Double click on it and select Group field as name
In the aggregates select as below
Name Subject Type Value
name rank Sum
4) Connect the two Steps( i.e., connect "Microsoft Excel Input" and "Group By" with an Hop.
5) See the preview (Use Debug this transformation).
6) Sort the output that you got from step 5.
Drag and drop "Sort rows" step from Design ->Transform.
connect "Group By" step to "Sort rows" step using a hop.
7) After sorting add another step say "Group By 2" to your transformation and now see the preview of the transformation.
Kettle Design Image:
Step 2: Kettle Transformation as Data source in pentaho CDE
1) Layout section :
Design and develop your dashboard as per your requirement.
2) Components section:
Take a bar chart and give place holder for that using html object
3) Data sources section:
i) Select "KETTLE Queries" and then click on "kettle over kettle TransFromFile"
ii) Give name and locate your .ktr file and then write the step name from where you are getting output in your transformation.. In this example step name is : Group by 2 (note that white spaces are there in name)
iii) Give the name of this data source in component section for your chart data source.
Thats it. you have done with working with Kettle as data source for pentaho CDE dashboarding.
Sample output of this example
Down load source code of this example here
References :
1) http://codeissue.com/articles/a04f273a99579d2/
Pedros blog post:
2) http://pedroalves-bi.blogspot.in/2011/07/elasticsearch-kettle-and-ctools.html
Pedros blog post:
2) http://pedroalves-bi.blogspot.in/2011/07/elasticsearch-kettle-and-ctools.html
Subscribe to:
Posts (Atom)