Showing posts with label cde. Show all posts
Showing posts with label cde. Show all posts
Monday, February 16, 2015
Exporting CDE dashboard to pdf the usage of PRD for CDE
Hello guys...
Exporting chart components as images to pdf in pentaho CDE - Simple Example
Here is the functionality of exporting CDE chart components to pdf file using PRD.
Environment :
C-Tools : V13.09
Pentaho Server : 4.8
Database : foodmart (jasperserver default database)
Web browser : Mozilla Firefox
NOTE : This post is specific to export chart component(s) to pdf but not the table component you are seeing in the images in this post.
What you can learn from this example ?
1) Make use of button component for exporting dashboard charts to PDF.
2) What is CGG component ? How you can make use of CGG component in exporting charts as images to PDF ?
3) How you can use PRD(.prpt) tool to export the images to PDF.
4) How to pass parameters in the URL when you export the dashboard charts as images in pdf file.
Example :
1) Lay out section
* Design and develop your dashboard as per your requirement.
* Find the image below
 2) Data sources section
(Talking about chart only)
* Give database connections and write a simple query which gives meaning full visualization.
* For example:
SELECT fname,customer_region_id FROM customer LIMIT 6
3) Components section
i) Take button component from others give place holder in layout section as shown in first image
ii) Give:
Name : ExportToPDF
Label: ExportToPDF
HtmlObject: ExportPDF
Expression :
Write below code:
function sendParameter(scene){
var url=http://localhost:8085/pentaho/content/reporting/reportviewer/report.html?solution=CDEExploring&path=%2FDevelopement%2FExporting&name=ExportPDF.prpt&locale=en_US;
window.location=url
}
Code image is shown below.

Well come to know from where we are taking the code above seen in image.
Here PRD(Pentaho Report Designer) comes into picture to export the CDE dashboard charts to pdf or any other format.
Below steps are the work around with CGG(Community Graphics Generator) & PRD
For CGG complete reference find Pedros blog here
From web details http://www.webdetails.pt/ctools/cgg.html
Steps :
1) Preview your dashboard
2) Press shift+G .. you will find pop up of CGG and URL generated for the charts in your dashboard.
i.e., once you click shift+G , pentaho Engine generates .js files related to that particular chart(s).
3) Take that URL and paste in any web browser address bar (Mozilla is preferable).
itll generate the images of that particular .js file(i.e., for that particular URL).
4) Your browser directly doesnt know from where the data is coming.. so you need to provide the user name and password of your pentaho(for instance: if you run pentaho on joe and password for 4.8 BA server you need to give these details)
Example:
http://localhost:8085/pentaho/content/cgg/Draw?script=/CDEExploring/Developement/Exporting/DashboardExport_BarChart.js&outputType=png&userid=joe&password=password
Note that if your chart in the dashboard is using any parameter you need to pass them by adding to the url
Syntax for adding parameters : ¶m_name=parameter_value
Example : ¶m_country=USA
5) Now, open PRD and save the .prpt file
6) Drag and drop image to "Report Header"(Preferable band) and double click on it. Give the same URL for that image, also adjust height ,width of the image. You will find the same image that you seen in web browser here in PRD image component.(If you wont find you missed some where in the development).
7) Now publish the .prpt file to Pentaho BA server.. [the folder which you are keeping your dashboards is preferable to publish your report]
[the same way you publish schema]
8) See the preview of the report.. there you can export generated output to different formats.. lets say pdf, xlx, html and etc.
9) After seeing the preview of the .prpt file, open the same using" Open in New window" which generates the URL for that..
10) Give the same URL in Button component " Export" property which you can find in step 3(Components section).
Thats it.. you have done with exporting chats of dashboard to pdf and other formats..
Find the images below for the same
step 1 & 2 image:

step 3 and 4 image:

Step 5 and 6 image:

Step 7 images:

Step 10 output:

Reference :
http://www.ambientbi.co.uk/?p=357
Hoping that this tutorial is helpful also hoping that there will be direct export functionality in pentaho CDE in upcoming releases from pentaho(Pedro).
Suggestions/Improvement of post are welcome in comments box :)
Exporting chart components as images to pdf in pentaho CDE - Simple Example
Here is the functionality of exporting CDE chart components to pdf file using PRD.
Environment :
C-Tools : V13.09
Pentaho Server : 4.8
Database : foodmart (jasperserver default database)
Web browser : Mozilla Firefox
NOTE : This post is specific to export chart component(s) to pdf but not the table component you are seeing in the images in this post.
What you can learn from this example ?
1) Make use of button component for exporting dashboard charts to PDF.
2) What is CGG component ? How you can make use of CGG component in exporting charts as images to PDF ?
3) How you can use PRD(.prpt) tool to export the images to PDF.
4) How to pass parameters in the URL when you export the dashboard charts as images in pdf file.
Example :
1) Lay out section
* Design and develop your dashboard as per your requirement.
* Find the image below
(Talking about chart only)
* Give database connections and write a simple query which gives meaning full visualization.
* For example:
SELECT fname,customer_region_id FROM customer LIMIT 6
3) Components section
i) Take button component from others give place holder in layout section as shown in first image
ii) Give:
Name : ExportToPDF
Label: ExportToPDF
HtmlObject: ExportPDF
Expression :
Write below code:
function sendParameter(scene){
var url=http://localhost:8085/pentaho/content/reporting/reportviewer/report.html?solution=CDEExploring&path=%2FDevelopement%2FExporting&name=ExportPDF.prpt&locale=en_US;
window.location=url
}
Code image is shown below.
Well come to know from where we are taking the code above seen in image.
Here PRD(Pentaho Report Designer) comes into picture to export the CDE dashboard charts to pdf or any other format.
Below steps are the work around with CGG(Community Graphics Generator) & PRD
For CGG complete reference find Pedros blog here
From web details http://www.webdetails.pt/ctools/cgg.html
Steps :
1) Preview your dashboard
2) Press shift+G .. you will find pop up of CGG and URL generated for the charts in your dashboard.
i.e., once you click shift+G , pentaho Engine generates .js files related to that particular chart(s).
3) Take that URL and paste in any web browser address bar (Mozilla is preferable).
itll generate the images of that particular .js file(i.e., for that particular URL).
4) Your browser directly doesnt know from where the data is coming.. so you need to provide the user name and password of your pentaho(for instance: if you run pentaho on joe and password for 4.8 BA server you need to give these details)
Example:
http://localhost:8085/pentaho/content/cgg/Draw?script=/CDEExploring/Developement/Exporting/DashboardExport_BarChart.js&outputType=png&userid=joe&password=password
Note that if your chart in the dashboard is using any parameter you need to pass them by adding to the url
Syntax for adding parameters : ¶m_name=parameter_value
Example : ¶m_country=USA
5) Now, open PRD and save the .prpt file
6) Drag and drop image to "Report Header"(Preferable band) and double click on it. Give the same URL for that image, also adjust height ,width of the image. You will find the same image that you seen in web browser here in PRD image component.(If you wont find you missed some where in the development).
7) Now publish the .prpt file to Pentaho BA server.. [the folder which you are keeping your dashboards is preferable to publish your report]
[the same way you publish schema]
8) See the preview of the report.. there you can export generated output to different formats.. lets say pdf, xlx, html and etc.
9) After seeing the preview of the .prpt file, open the same using" Open in New window" which generates the URL for that..
10) Give the same URL in Button component " Export" property which you can find in step 3(Components section).
Thats it.. you have done with exporting chats of dashboard to pdf and other formats..
Find the images below for the same
step 1 & 2 image:
step 3 and 4 image:
Step 5 and 6 image:
Step 7 images:
Step 10 output:
Reference :
http://www.ambientbi.co.uk/?p=357
Hoping that this tutorial is helpful also hoping that there will be direct export functionality in pentaho CDE in upcoming releases from pentaho(Pedro).
Suggestions/Improvement of post are welcome in comments box :)

Fill Colour of bar s based on a condition in Pentaho CDE
This post will talk about conditional colours of bars with below like scenarios.
Sample Scenario :
Print bar color as red when bar value <=2000
Print bar color as green when bar value >2000 and <10000
Print bar color as black when bar value>=10000
Scenario 2 :
When representing -Ve values on charts .. this kind of representation is preferable.
Code is Taken from Reference links :
function changeBars(){
var cccOptions = this.chartDefinition;
// For changing extension points, a little more work is required:
var eps = Dashboards.propertiesArrayToObject(cccOptions.extensionPoints);
// add extension points:
eps.bar_fillStyle = function getColor(){
var val = this.scene.vars.value.value;
if(val > 0 && val <= 5000){
return red;
}
else if(val > 5000 && val <= 50000){
return green;
}
else{
return black;
}
};
// Serialize back eps into cccOptions
cccOptions.extensionPoints = Dashboards.objectToPropertiesArray(eps);
}
NOTE : I have tried directly in Extension points but it did not work.
Sample output 1 :

function changeBars(){
var cccOptions = this.chartDefinition;
// For changing extension points, a little more work is required:
var eps = Dashboards.propertiesArrayToObject(cccOptions.extensionPoints);
// add extension points:
eps.bar_fillStyle = function getColor(){
var val = this.scene.vars.value.value;
if(val == 26297.2900){
return black;
}
else{
return blue;
}
};
// Serialize back eps into cccOptions
cccOptions.extensionPoints = Dashboards.objectToPropertiesArray(eps);
}

References :
http://translate.google.com/translate?&ie=UTF-8&sl=&tl=en&u=http://www.redopenbi.com/group/ctools/forum/topics/colores-en-bar-chart?commentId=2400100%3AComment%3A103280&xg_source=activity&groupId=2400100%3AGroup%3A73260
OR
http://www.redopenbi.com/group/ctools/forum/topics/colores-en-bar-chart?commentId=2400100%3AComment%3A103280&xg_source=activity&groupId=2400100%3AGroup%3A73260
OR
http://forums.pentaho.com/showthread.php?150582-Bar-chart-colors-dynamically-changed-based-on-data-value-Along-with-JavaScript-vars
Sample Scenario :
Print bar color as red when bar value <=2000
Print bar color as green when bar value >2000 and <10000
Print bar color as black when bar value>=10000
Scenario 2 :
When representing -Ve values on charts .. this kind of representation is preferable.
Code is Taken from Reference links :
function changeBars(){
var cccOptions = this.chartDefinition;
// For changing extension points, a little more work is required:
var eps = Dashboards.propertiesArrayToObject(cccOptions.extensionPoints);
// add extension points:
eps.bar_fillStyle = function getColor(){
var val = this.scene.vars.value.value;
if(val > 0 && val <= 5000){
return red;
}
else if(val > 5000 && val <= 50000){
return green;
}
else{
return black;
}
};
// Serialize back eps into cccOptions
cccOptions.extensionPoints = Dashboards.objectToPropertiesArray(eps);
}
NOTE : I have tried directly in Extension points but it did not work.
Sample output 1 :
Sample output 2 :
function changeBars(){
var cccOptions = this.chartDefinition;
// For changing extension points, a little more work is required:
var eps = Dashboards.propertiesArrayToObject(cccOptions.extensionPoints);
// add extension points:
eps.bar_fillStyle = function getColor(){
var val = this.scene.vars.value.value;
if(val == 26297.2900){
return black;
}
else{
return blue;
}
};
// Serialize back eps into cccOptions
cccOptions.extensionPoints = Dashboards.objectToPropertiesArray(eps);
}
References :
http://translate.google.com/translate?&ie=UTF-8&sl=&tl=en&u=http://www.redopenbi.com/group/ctools/forum/topics/colores-en-bar-chart?commentId=2400100%3AComment%3A103280&xg_source=activity&groupId=2400100%3AGroup%3A73260
OR
http://www.redopenbi.com/group/ctools/forum/topics/colores-en-bar-chart?commentId=2400100%3AComment%3A103280&xg_source=activity&groupId=2400100%3AGroup%3A73260
OR
http://forums.pentaho.com/showthread.php?150582-Bar-chart-colors-dynamically-changed-based-on-data-value-Along-with-JavaScript-vars
Saturday, February 14, 2015
Cascading parameters example in Pentaho CDE
Hi Guys,
It is quite easy to learn about cascading parameters in pentaho CDE dash boarding.
Example below teach you how to give cascading parameters on CDE dashboard.
Environment :
C-Tools 13.09
Pentaho BA Server 4.8 stableb
DB : postgreSQL foodmart ( jasperservers database)
IDEA of cascading parameters:


:-)
It is quite easy to learn about cascading parameters in pentaho CDE dash boarding.
Example below teach you how to give cascading parameters on CDE dashboard.
Environment :
C-Tools 13.09
Pentaho BA Server 4.8 stableb
DB : postgreSQL foodmart ( jasperservers database)
IDEA of cascading parameters:
Example:
1) Lay out section
* Design your lay out for keeping the parameters on dasbharod.
* Sample reference design of layout.
2) Components section
* You need to define 3 selects for 3 parameters
* You need to define 3 parameters
* Observer the Sample worked out image below
*
* Define 2 parameters for country and state(paramCountry and paramState)
* Define 3 Selects for displaying the selection of parameters on dashboard.
( CountrySelectComponent, StateSelectComponent, CitySelectComponent)
Parameters
1. ParamCountry
i.e, Name= paramCountry and Propertyvalue=USA(default value)
2. paramState
Name=paramState and Propertyvalue=OR(default value)
NOTE : you need NOT to create parameter for city in this case.
Select Components
* Select components are used to display the data coming from sequel query on dashboard as drop down list at the respected place holders.
1) CountrySelectComponent
Name: CountrySelecte Component
Parameter: paramCouentry (you should give param name otherwise, it wont work)
Datasource: give the query name (will discussion in Datasource selection)
HtmlObject : countrySelect
2)StateSelectComponent
Name: StateSelectComponent
Parameter : paramState
Listners : paramCountry
Parameters : Arg(paramCountry) and val(paramCountryP)
Datasource : queryState
HtmlObject : stateSelect
3) CitySelectComponent
* You need add two listners and two parameters at Listerns and parameters properties
Name;CitySelectComponent
Parameter : No need to give any parameters name here as we are not using parameter for city sleelct
Listners : paramState,paramCountry
Parameters :
Arg(paramCountry) and val(paramCountry)
Arg(paramState) and val(paramState)
Datasource : queryCity
HtmlObject : citySelect
3) Data Sources section:
Write queries for 3 selects
1) queryCountry(above image)
Name: queryCountry
Driver: org.postgresql.Driver
User name : postgres
Password : postgres
URL : jdbc:postgresql://localhost:6062/foodmart (5432 is the default port number for postgreSQL)
Query: SELECT DISTINCT country from customer
Parameters : paramCountry(arg) and paramCountry(val)
2) queryState(image is not shown in post refere queryCountry image)
Name: queryState
Driver: org.postgresql.Driver
User name : postgres
Password : postgres
URL : jdbc:postgresql://localhost:6062/foodmart (5432 is the default port number for postgreSQL)
Query: SELECT DISTINCT state_province from customer where country=${paramCountry}
Parameters : paramCountry(arg) and paramCountry(val)
3) queryCity(image is not shown in post refere queryCountry image)
Name: queryCity
Driver: org.postgresql.Driver
User name : postgres
Password : postgres
URL : jdbc:postgresql://localhost:6062/foodmart (5432 is the default port number for postgreSQL)
Query: SELECT DISTINCT city from customer WHERE country=${paramCountry} AND state_province=${paramState}
Parameters : paramCountry(arg) and paramCountry(val)
paramState(arg) and paramState(val)
Save the dashboard and see the preview.
Final output:
1) Test 1
2) Test2
Thank you for reading this post :) :)
for queries and suggestions : sadakar.1988@gmail.com
SOURCE CODE OF THIS EXAMPLE:
https://drive.google.com/file/d/0BymV_QP4TGBEZGhpb1hySDBoSEE/edit?usp=sharing
Toggle between two Divs for Pentaho CDE Charts
This post will cover the toggling among the charts.
i.e., Share one place holder for multiple charts by providing a link or a button.
Example developed on :
C-Tools of 14.07.29, foodmart of postgresql, pentaho 5.0.1 CE stable.
Step 1 : Layout section.
1) Save the dashboard in bootstrap mode.
2) Row ->Column->Html
In Html write below code :
<p><a href="#" id="link">Show B</a></p>
<div id="a"></div>
<div id="b"></div>
<script type="text/javascript">
var $divA = $(#a),
$divB = $(#b),
$link = $(#link);
// Initialize everything
$link.text( Pie );
$divA.hide();
$link.click(function(){
// If A is visible when the link is clicked
// you need to hide A and show B
if( $divA.is( :visible ) ){
$link.text( Pie );
$divA.hide();
$divB.show();
} else {
$link.text( Bar );
$divA.show();
$divB.hide();
}
return false;
});
</script>
Step 2: Data Sources section
1) Give all the connection details.
Name : query1
URL : jdbc:postgresql://localhost:5432/foodmart
Driver : org.postgresql.Driver
Username/Password : postgres/postgres
Query :
SELECT * FROM
(
SELECT
DISTINCT brand_name AS "Brand Name",
SUM(unit_sales) AS "Sales"
FROM product p
INNER JOIN sales_fact_1997 sf7
ON p.product_id=sf7.product_id
INNER JOIN time_by_day t
ON sf7.time_id=t.time_id
WHERE
(
to_char(t.the_date,YYYY-MM-DD)>=2012-01-01
AND
to_char(t.the_date,YYYY-MM-DD)<=2012-01-07
)
GROUP BY "Brand Name"
ORDER BY SUM(unit_sales) DESC
limit 5
)table1
Step 3 : Components section
1) Take pie chart & bar chart.
2) Set all the properties like name, htmlObject (for pie take "a" as htmlObject and for bar chart "b" as htmlObject).
3) Save your dashboard and see the preview.
Sample output:
Image 1 : Pie Chart.

Image 2 : Perform click action on Pie you will get bar chart in place of pie chart that means you are toggling b/w two chart (i.e., Single place holder is sharing by two charts and the logic of two divs applied for CDE charts).

Download example here : Click Me
References :
1) http://jsfiddle.net/QAxgD/
2) http://stackoverflow.com/questions/18110320/toggle-between-two-divs
3) http://forums.pentaho.com/showthread.php?170449-How-To-Toaggle-Between-Chart-amp-Grid
i.e., Share one place holder for multiple charts by providing a link or a button.
Example developed on :
C-Tools of 14.07.29, foodmart of postgresql, pentaho 5.0.1 CE stable.
Step 1 : Layout section.
1) Save the dashboard in bootstrap mode.
2) Row ->Column->Html
In Html write below code :
<p><a href="#" id="link">Show B</a></p>
<div id="a"></div>
<div id="b"></div>
<script type="text/javascript">
var $divA = $(#a),
$divB = $(#b),
$link = $(#link);
// Initialize everything
$link.text( Pie );
$divA.hide();
$link.click(function(){
// If A is visible when the link is clicked
// you need to hide A and show B
if( $divA.is( :visible ) ){
$link.text( Pie );
$divA.hide();
$divB.show();
} else {
$link.text( Bar );
$divA.show();
$divB.hide();
}
return false;
});
</script>
Step 2: Data Sources section
1) Give all the connection details.
Name : query1
URL : jdbc:postgresql://localhost:5432/foodmart
Driver : org.postgresql.Driver
Username/Password : postgres/postgres
Query :
SELECT * FROM
(
SELECT
DISTINCT brand_name AS "Brand Name",
SUM(unit_sales) AS "Sales"
FROM product p
INNER JOIN sales_fact_1997 sf7
ON p.product_id=sf7.product_id
INNER JOIN time_by_day t
ON sf7.time_id=t.time_id
WHERE
(
to_char(t.the_date,YYYY-MM-DD)>=2012-01-01
AND
to_char(t.the_date,YYYY-MM-DD)<=2012-01-07
)
GROUP BY "Brand Name"
ORDER BY SUM(unit_sales) DESC
limit 5
)table1
Step 3 : Components section
1) Take pie chart & bar chart.
2) Set all the properties like name, htmlObject (for pie take "a" as htmlObject and for bar chart "b" as htmlObject).
3) Save your dashboard and see the preview.
Sample output:
Image 1 : Pie Chart.
Image 2 : Perform click action on Pie you will get bar chart in place of pie chart that means you are toggling b/w two chart (i.e., Single place holder is sharing by two charts and the logic of two divs applied for CDE charts).
Download example here : Click Me
References :
1) http://jsfiddle.net/QAxgD/
2) http://stackoverflow.com/questions/18110320/toggle-between-two-divs
3) http://forums.pentaho.com/showthread.php?170449-How-To-Toaggle-Between-Chart-amp-Grid
Thursday, February 12, 2015
Fetch selected columns from SQL query on Table Component using Penaho CDE
Hi....
A requirement made me to write this post which will talk about fetching few columns on the table component from SQL query.....
Requirement :
Get 5 columns using query in CDA but fetch only 4 columns on the table component...
Fetch columns first column to fifth column excluding 4th column...
Write below code PostFetch of table Component.
function removeColumns(cdaData) {
var valueColIndex = 3;
//var valueColIndex2=2; /*initializing 2nd colum with its index */
//var valueColIndex3=1; /*initializing 1st column with its index */
// Remove metadata column
cdaData.metadata.splice(valueColIndex, 1/*remove count*/);
//cdaData.metadata.splice(valueColIndex2, 1/*remove count*/);
//cdaData.metadata.splice(valueColIndex3, 1/*remove count*/);
// Remove resultset column, from each row
cdaData.resultset.forEach(function(row) {
row.splice(valueColIndex, 1/*remove count*/);
//row.splice(valueColIndex2, 1/*remove count*/);
//row.splice(valueColIndex3, 1/*remove count*/);
});
// Return modified cda data set
return cdaData;
}
Write below code in Pre Execution of Table Component
//Specify the columns which you are removin
function f() {
this.chartDefinition.readers = [
{indexes: 3 /* Value2 */},
//{indexes: 1 /* Value2 */}
//{indexes: 2 /* Value2 */}
];
}
Alternative solution which will reduce writing above code :
Write below code in "Post Execution" of table component. column indexes start from 1 ,2,3 and etc if you write this code.
function myTip()
{
$(th:nth-child(5),td:nth-child(5)).hide(); //hides 5th column
$(th:nth-child(),td:nth-child(10)).hide();//hides 10th column
}
NOTE:
1) Query fields indexes start from 0 and ends with N-1 where N is the number of fields coming from query.
2) You can fetch as many columns from the query result set as you want.
3) See the commented code to remove the other columns...
NOTE that the code in Pre Execution may not accurate but worked fine for the requirement.
Thank you.
References :
1) http://forums.pentaho.com/archive/index.php/t-143075.html
2) http://forums.pentaho.com/showthread.php?143075-specifying-columns-for-pie-chart-in-CDE
3)http://www.webdetails.pt/ctools/charts/jsdoc/symbols/pvc.options.charts.Chart.html#readers
A requirement made me to write this post which will talk about fetching few columns on the table component from SQL query.....
Requirement :
Get 5 columns using query in CDA but fetch only 4 columns on the table component...
Fetch columns first column to fifth column excluding 4th column...
Write below code PostFetch of table Component.
function removeColumns(cdaData) {
var valueColIndex = 3;
//var valueColIndex2=2; /*initializing 2nd colum with its index */
//var valueColIndex3=1; /*initializing 1st column with its index */
// Remove metadata column
cdaData.metadata.splice(valueColIndex, 1/*remove count*/);
//cdaData.metadata.splice(valueColIndex2, 1/*remove count*/);
//cdaData.metadata.splice(valueColIndex3, 1/*remove count*/);
// Remove resultset column, from each row
cdaData.resultset.forEach(function(row) {
row.splice(valueColIndex, 1/*remove count*/);
//row.splice(valueColIndex2, 1/*remove count*/);
//row.splice(valueColIndex3, 1/*remove count*/);
});
// Return modified cda data set
return cdaData;
}
Write below code in Pre Execution of Table Component
//Specify the columns which you are removin
function f() {
this.chartDefinition.readers = [
{indexes: 3 /* Value2 */},
//{indexes: 1 /* Value2 */}
//{indexes: 2 /* Value2 */}
];
}
Alternative solution which will reduce writing above code :
Write below code in "Post Execution" of table component. column indexes start from 1 ,2,3 and etc if you write this code.
function myTip()
{
$(th:nth-child(5),td:nth-child(5)).hide(); //hides 5th column
$(th:nth-child(),td:nth-child(10)).hide();//hides 10th column
}
NOTE:
1) Query fields indexes start from 0 and ends with N-1 where N is the number of fields coming from query.
2) You can fetch as many columns from the query result set as you want.
3) See the commented code to remove the other columns...
NOTE that the code in Pre Execution may not accurate but worked fine for the requirement.
Thank you.
References :
1) http://forums.pentaho.com/archive/index.php/t-143075.html
2) http://forums.pentaho.com/showthread.php?143075-specifying-columns-for-pie-chart-in-CDE
3)http://www.webdetails.pt/ctools/charts/jsdoc/symbols/pvc.options.charts.Chart.html#readers
Bar chart with Target lines in pentaho CDE making bars as lines using java script in pentaho CDE
Hi guys,
This post teach you how to make bars as lines in pentaho CDE.
Source for this post is : http://jsfiddle.net/duarteleao/7maGD/
and http://type-exit.org/adventures-with-open-source-bi/2011/06/creating-dashboards-with-cde/
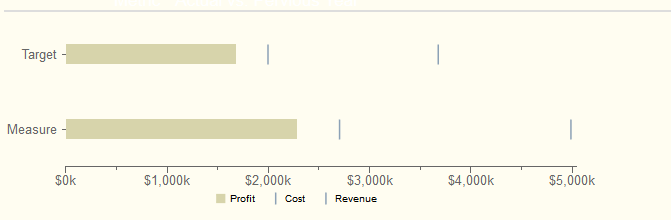
Scenario : Some end users wants visualization of grouped bars as lines where one of the bar is as bar and remaining bars as targeted lines on the same bar.
Properties have to give:
Plot2 : True
Find the remaining properties in below image: version of CDE is : 13.06 but will work in higher versions also.
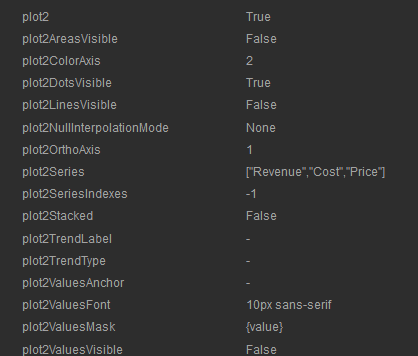
NOTE: Find the image for how to give the above code as properties in Extension points of chart component.
Sample output of the chart on dashboard after giving the above properties.
Sadakar
BI developer
("Learning never exhausts the mind")
This post teach you how to make bars as lines in pentaho CDE.
Source for this post is : http://jsfiddle.net/duarteleao/7maGD/
and http://type-exit.org/adventures-with-open-source-bi/2011/06/creating-dashboards-with-cde/
Scenario : Some end users wants visualization of grouped bars as lines where one of the bar is as bar and remaining bars as targeted lines on the same bar.
Properties have to give:
Plot2 : True
Find the remaining properties in below image: version of CDE is : 13.06 but will work in higher versions also.
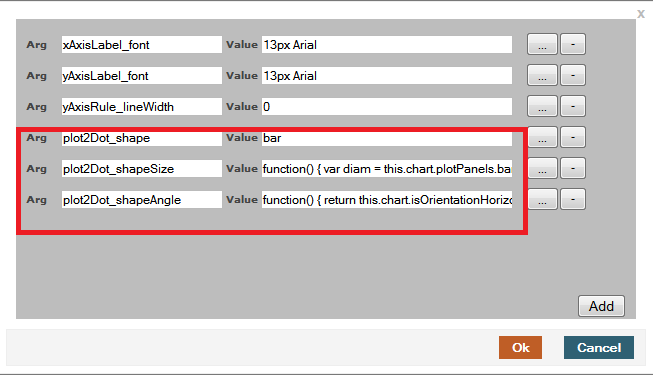
In "Extension points" for the chart component you need to give 3 properties from the first link.
They are
extensionPoints: {
plot2Dot_shape: bar,
plot2Dot_shapeSize: function() {
var diam = this.chart.plotPanels.bar.barWidth ||
this.chart.options.barSizeMax;
return this.finished(diam);
},
plot2Dot_shapeAngle: function() {
return this.chart.isOrientationHorizontal() ? 0 : -Math.PI/2;
}
plot2Dot_shape: bar,
plot2Dot_shapeSize: function() {
var diam = this.chart.plotPanels.bar.barWidth ||
this.chart.options.barSizeMax;
return this.finished(diam);
},
plot2Dot_shapeAngle: function() {
return this.chart.isOrientationHorizontal() ? 0 : -Math.PI/2;
}
NOTE: Find the image for how to give the above code as properties in Extension points of chart component.
Sample output of the chart on dashboard after giving the above properties.
Sadakar
BI developer
("Learning never exhausts the mind")
Wednesday, February 11, 2015
Tip Remove Disable Edit Option Mode For wcdf CDE Files in Pentaho 5 x Production Community Server
Hi Guys,
Below tip is used for disable Edit Mode of CDE dashboards ..
When this is useful ?
CASE 1 :
If you are not going for Embedding BI to integrate the CDE dashboards.
CASE 2:
If you dont want your end user to open the CDE file to view the CODE.. If you are using the Server itself in your end client location he/she also may not need all these except logging into the server and see the dashboards...
For doing this.. i.e., to disable the Edit mode of CDE dashboards, you just need to comment below code in plugin.xml file of pentaho-cdf-dd folder.
File location : /home/sadakar/softwares installed/Pentaho/biserver-ce/pentaho-solutions/system/pentaho-cdf-dd
<!--
<operation>
<id>EDIT</id>
<perspective>wcdf.edit</perspective>
</operation>
-->
Sample Image:

NOTE: As it is a configuration file, you need to restart the server once the changes done to it.
Another Imp NOTE:
As C-Tools(CDE,CDF,CDA) are uneatable from Marketplace, and if you go for any upgrade of them then you might lost this configuration.. what itll do internally when you upgrade to new versions of C-Tools, internally itll uninstall the plug-ins and then download the new.. hence as you will get a fresh copy you there might be a chance of losing your settings.. This is not tested..
Thank you :-)
Sadakar
BI developer
Pentaho/Jasper/Talend ETL
Below tip is used for disable Edit Mode of CDE dashboards ..
When this is useful ?
CASE 1 :
If you are not going for Embedding BI to integrate the CDE dashboards.
CASE 2:
If you dont want your end user to open the CDE file to view the CODE.. If you are using the Server itself in your end client location he/she also may not need all these except logging into the server and see the dashboards...
For doing this.. i.e., to disable the Edit mode of CDE dashboards, you just need to comment below code in plugin.xml file of pentaho-cdf-dd folder.
File location : /home/sadakar/softwares installed/Pentaho/biserver-ce/pentaho-solutions/system/pentaho-cdf-dd
<!--
<operation>
<id>EDIT</id>
<perspective>wcdf.edit</perspective>
</operation>
-->
Sample Image:
NOTE: As it is a configuration file, you need to restart the server once the changes done to it.
Another Imp NOTE:
As C-Tools(CDE,CDF,CDA) are uneatable from Marketplace, and if you go for any upgrade of them then you might lost this configuration.. what itll do internally when you upgrade to new versions of C-Tools, internally itll uninstall the plug-ins and then download the new.. hence as you will get a fresh copy you there might be a chance of losing your settings.. This is not tested..
Thank you :-)
Sadakar
BI developer
Pentaho/Jasper/Talend ETL
Tuesday, February 10, 2015
Kettle transformation as data source in Pentaho CDE OR Excel sheet as data source for pentaho CDE dashboard
Hello Guys..
Scenario :
If you receive excel sheet or csv file as data source then how to create dashboard charts or tables in pentaho CDE ?
Like jasper here we do not have any direct way to connect excel sheet as a data source. Here in Pentaho suite we need to make use of Kettle(PDI) to work out with Excel or CSV data sources.
Current post is an example of using Excel data source for Pentaho CDE dashboard.
This post is not using any parameters(Need to work out with parameters and update this blog post).
Aim of the Example:
Creating dashboard charts using Excel Datasheet
Environment :
1) PDI(Kettlle)- 4.4 stable
2) Pentaho BA server - 4.8 stable
3) Excel data source(with .xls extension)
4) Pentaho C-Tools(13.09 version)
5) Web browser(Mozilla is preferable)
Example :
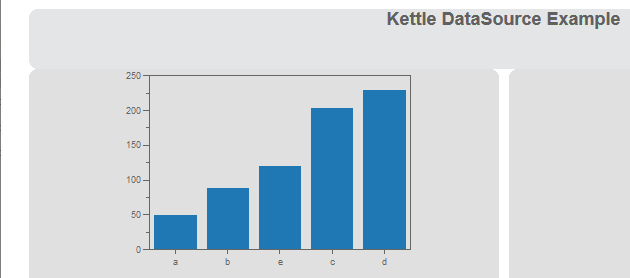
Displaying bar chart group by summation of ranks in ascending order. (just an example data sheet)
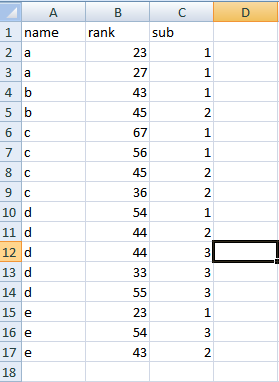
Display names on X-axis and summation of ranks on Y-axis on Pentaho CDE chart...
Data display should be grouped by name .
Data display should be grouped by name .
NOTE:
Save your kettle file in the folder where you also saving the CDE files.
i.e., Generally in 4.8 BA server
under pentaho-solutions/your project(dashboard) folder. Bz you need to pick the developed .ktr file from data sources section.
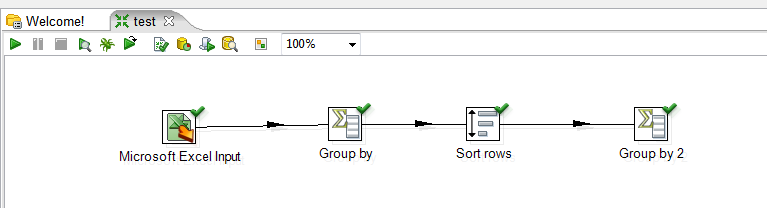
Steps:1 Working with PDI for Excel Data
1) Drag an drop Excel Input step.
Design-> Input -> Microsoft Excel Input ->
2) Double click on Microsoft Excel Input step and Browse for your excel file and then Add.
3) Drag and drop "Group By" step from Design->Statistics
Double click on it and select Group field as name
In the aggregates select as below
Name Subject Type Value
name rank Sum
4) Connect the two Steps( i.e., connect "Microsoft Excel Input" and "Group By" with an Hop.
5) See the preview (Use Debug this transformation).
6) Sort the output that you got from step 5.
Drag and drop "Sort rows" step from Design ->Transform.
connect "Group By" step to "Sort rows" step using a hop.
7) After sorting add another step say "Group By 2" to your transformation and now see the preview of the transformation.
Kettle Design Image:
Down load source code of this example here
References :
1) Drag an drop Excel Input step.
Design-> Input -> Microsoft Excel Input ->
2) Double click on Microsoft Excel Input step and Browse for your excel file and then Add.
3) Drag and drop "Group By" step from Design->Statistics
Double click on it and select Group field as name
In the aggregates select as below
Name Subject Type Value
name rank Sum
4) Connect the two Steps( i.e., connect "Microsoft Excel Input" and "Group By" with an Hop.
5) See the preview (Use Debug this transformation).
6) Sort the output that you got from step 5.
Drag and drop "Sort rows" step from Design ->Transform.
connect "Group By" step to "Sort rows" step using a hop.
7) After sorting add another step say "Group By 2" to your transformation and now see the preview of the transformation.
Kettle Design Image:
Step 2: Kettle Transformation as Data source in pentaho CDE
1) Layout section :
Design and develop your dashboard as per your requirement.
2) Components section:
Take a bar chart and give place holder for that using html object
3) Data sources section:
i) Select "KETTLE Queries" and then click on "kettle over kettle TransFromFile"
ii) Give name and locate your .ktr file and then write the step name from where you are getting output in your transformation.. In this example step name is : Group by 2 (note that white spaces are there in name)
iii) Give the name of this data source in component section for your chart data source.
Thats it. you have done with working with Kettle as data source for pentaho CDE dashboarding.
Sample output of this example
Down load source code of this example here
References :
1) http://codeissue.com/articles/a04f273a99579d2/
Pedros blog post:
2) http://pedroalves-bi.blogspot.in/2011/07/elasticsearch-kettle-and-ctools.html
Pedros blog post:
2) http://pedroalves-bi.blogspot.in/2011/07/elasticsearch-kettle-and-ctools.html
Subscribe to:
Posts (Atom)