Showing posts with label pentaho. Show all posts
Showing posts with label pentaho. Show all posts
Thursday, February 19, 2015
Installation of Pentaho 5 0 1 CE in windows 7 changes made from previous version
Being crazy of Pentaho and its associated tools Id like to share some thing about Pentaho CE 5.0.1 BA latest release..
First of all, Id like to thank you to the web details team for the efforts they kept in bringing up the powerful analytical engine(BA server).
The home page itself make you to stick with BA server where you can enter into the server with "admin" and "password" as the default credentials.. Yes, "joe" user is no more but he left with the same password to log into BA server.
There will be NO more admin console ... Now it is very easy and developer friendly to navigate in one console(User Console) to give data base connections and new roles for new users..
A lot of stuff included in the home page itself, giving the blogs links, books on different tools of pentaho family. In a single word I can say , All the stuff related to Pentaho at a single place. A BI developer like me can reduce the time for developing reports, dashboards , jobs.
Market place for installing C-Tools and the installed plug-ins list drop down is one of the good ideas of the team.
As quick as Pentaho released its CE 5.0.1 , I just downloaded and trying to explore the new look and navigating from all the menus, reports, connection places and etc.
Its very easy to install the pentaho CE BA now in windows...
Installation procedure :
1) Down load the software as a .zip file using this link .
2) Unzip it in your fav folder
3) Click on start-pantaho.bat file
Home page :
NOTE: path and class path for java must be set before the installation.
First of all, Id like to thank you to the web details team for the efforts they kept in bringing up the powerful analytical engine(BA server).
The home page itself make you to stick with BA server where you can enter into the server with "admin" and "password" as the default credentials.. Yes, "joe" user is no more but he left with the same password to log into BA server.
There will be NO more admin console ... Now it is very easy and developer friendly to navigate in one console(User Console) to give data base connections and new roles for new users..
A lot of stuff included in the home page itself, giving the blogs links, books on different tools of pentaho family. In a single word I can say , All the stuff related to Pentaho at a single place. A BI developer like me can reduce the time for developing reports, dashboards , jobs.
Market place for installing C-Tools and the installed plug-ins list drop down is one of the good ideas of the team.
As quick as Pentaho released its CE 5.0.1 , I just downloaded and trying to explore the new look and navigating from all the menus, reports, connection places and etc.
Its very easy to install the pentaho CE BA now in windows...
Installation procedure :
1) Down load the software as a .zip file using this link .
2) Unzip it in your fav folder
3) Click on start-pantaho.bat file
Home page :
NOTE: path and class path for java must be set before the installation.

Wednesday, February 18, 2015
Pentaho Opensource 5 0 1 stable Vs Jasper Professional 5 5 BA Server Tool selection decision making points on 3 categories
Hello Guys,
Here is a small document prepared on differentiating Pentaho Open source Vs Jasper Professional.
Based on the below information one can take decision on tool selection for BI needs.
I would like to present a clear picture with insight & readers of this document are encouraged to add your points in the comment box..
IMP NOTE: Remember , I am comparing the Pentaho Open source(Community) 5.0.1 stable with Jasper Professional(licensed) 5.5
Dashboards :
| Key feaute | Pentaho Open source Dashboard | Jasper Professional dashboard |
| Tool | Community Tools(C-Tools) – Server plug ins CDE(Community Dashboard Editor) CDF(Community Dashboard Framework) CDA(Community Data Access) | iReport/Jasper Studio Desktop stand alone tools |
| Development of Reports done at | Fly on the server itself | Depends on stand alone designing tools & need to publish to the server and again need to design the dashboard |
| Responsiveness /Mobile support | Responsiveness is achievable using bootstrap css framework | Lack of responsiveness even though there is Proprtional property of the dashboard designer |
| Dashboards output end view-able devices | Compatible with Mobile/iPad/laptop/Desktop/TV like big screens | Compatible with laptop/desktop |
| Charts | Protovis charts implemented, extend able to D3 charts.. can integrate fusion and HTML charts also. | Embedded charts engines – Jfree, Fusion & HTML5 charts. Can integrate protovis/D3 charts using html component of iReport/Jasper Studio |
| Loading of charts on the dashboard | Will take lesser time using Pentahos powerful caching mechanism | Will take longer time to load the charts on the dashboard |
| Embedding BI | Achievable using iframe tags | Achievable using iframe tags |
| Community support | Active | Active as it is a professional .. general community is not so active |
| Interactivity/Drill down/ Inter charts(frames) communication | Achievable | Achievable |
| Multi-tenancy | Need to check (will update on this) | Achievable |
| Customization | Developer friendly | Not developer friendly |
| Download here | Pentaho Maket Place or install using ctools-installer.sh http://community.pentaho.com/ | Purchase license https://www.jaspersoft.com/jaspersoft-business-intelligence-software-trial |
Analysis : OLAP Cubes
| Key feature | Pentaho Open source Analysis | Jasper Opensource/Pro Analysis | |
| Desktop Stand alone Development Tool | Pentaho Schema workbench | Schema Workbench | |
| Front End tool to view the output | Pviot4J Analytics (or) Saiku Analytics (or) JPivot View (or) BTable (or) Ivy Schema Editor | JPivot View | |
| Ad-hoc Reporting on Cube ouptut | Yes, using Saiku Analytics | Ad-hoc Editor (For jasper pro & enterprise it is an add-on feature. http://www.jaspersoft.com/editions | |
| Query Language | MDX ( Multi Dimensional Expression) | MDX (Mullti Dimensional Expression) | |
| Caching | Enabled – Very fast access of data | Enabled – some what less speed when compared with pentaho server | |
| Community Support | Very Active – Quick Responses | Not so active as it is not a owned product of jasper/tibco | |
| Documentation | Online documentation available with examples | Online pdf documentation is available with Examples |
Ad-hoc Reporting
| Key feature | Pentaho Open source Ad-hoc | Pentaho Enterprise Ad-hoc | Jasper Pro Ad-hoc |
| Source for ad-hoc reporting | Meta data layer creation | Meta data layer creation | Create topics OR Create Domains |
| Tool | Pentaho Meta Data Editor(PME) (Stand alone desktop tool) (OR ) Create JOINS on the fly on the server and use it for ad-hoc reporting | PME | No desktop tool.. directly in the server create Domains OR topics |
| Output Server tools | WAQR – Web Ad-hoc Query and Reporting (OR) Saiku Reporting compatible with 4.8 server as of now | Interactive Reporting - Advanced of WAQR But WAQR is not supported by any more Interactive reporting is an extension of WAQR in Enterprise Version of pentaho | Jasper Ad-hoc Editor |
| Support | Deprecated – No longer supported by penatho | On demand support | On demand – Need to be jasper customer |
| Visualization of Data in the form of charts | No | No | Yes .. using Ad-hoc report output visualization of data in the form of selected charts . |
Readers of this post is encouraged to add your points/suggestions in comment box..
Thank you.
Sadakar
BI developer
Tuesday, February 17, 2015
Access Control Concept in Pentaho Schema Workbench Saiku Analytics tool Display Restrict Role based Cubes Dimensions Hirachies levels
Its been a long time, I have explored some concepts in Pentaho Analysis using PSW(Pentaho Schema Workbench).
Here is a small workout on giving access of CUBES, Hierarchies,members to different users based on roles assigned to them.
You may not find what you need exactly in this article but I can say surely that, you will get some idea on below topics
1) Creating Users & Roles in the BA Server.
2) Assigning Roles to Users.
3) How BA server will identify the roles created in PSW with the roles in BA Server.
4) Developing a Schema of 2 sample CUBES
5) Scenario on the schema
Software Setup:
Pentaho BA Server 5.x
PostgreSQL Server 9.x [Food Mart Database]
Pentaho Schema Workbench :3.8.0.0-209
Saiku Analytics : 2.6-PENTAHO5-SNAPSHOT (TRUNK)
Assuming you have initial idea on how to design a sample CUBE..
(For creating sample cubes you can follow this tutorial :
http://pentaho-bi-suite.blogspot.in/2013/12/pentaho-schema-workbench-simple-example.html
)
Concept : Access Control
Problem Statement :
1) Give Access of CUBE 1 to User 1 who is assigned with Role 1
Schema grant, Cube grant, Hierarchy grant, member grant .
2) Give Access of CUBE 2 to User 2 who is assigned with Role 2
Step 1 : How to built role mapper communication in BA Server for created roles in mondrian ?
- Enable mondrian user/role mapper in pentahoObjects.spring.xml
- File location : /Pentaho/biserver-ce/pentaho-solutions/system
<!-- This mondrian user/role mapper assumes that roles from the platform also exist in mondrian -->
<!--
Disabled by default in 3.5.2. In trunk, this should be enabled.
-->
<bean id="Mondrian-UserRoleMapper"
name="Mondrian-One-To-One-UserRoleMapper"
class="org.pentaho.platform.plugin.action.mondrian.mapper.MondrianOneToOneUserRoleListMapper"
scope="singleton" />
NOTE : If your BA server is already running , just stop and restart it.
Thats it.. Now the Roles assigned in schema will mapped to the roles assigned in BA server.(for users).
Step 2 : Creating Schema with 2 CUBES
Let us take food-mart database(modelled for multidimensional database) and design below CUBES.
CUBE 1 ---> Sales
CUBE 2----> HR
Cube Design Image is shown below :

Open it with your PSW...
The design has the following concepts :
i) Dimension Usage :
Create a dimension outside the CUBES( i.e., Right Click Schema -> Create Dimension) and make use of it in CUBES as Dimension Usage.
(i.e, If 2 CUBES use the same dimension, we need not to create it 2 times. We can create one time and use that dimension which ever the CUBE needs for its specific purpose).
In this example schema : I made use of two shared dimensions as Dimension Usage. Those are Store and Time
ii) Calculated Member(CM).
To calculate the measures.. for example : To find profit in this example.
It will results as a new measure in the output.
Step 3 : How to create Users & Roles?
Users :
- Log-in into your server with Admin/password first(login as Administrator).
- In BA Server Click on "Administration" from the dropdown Home menu.
- Create 2 Users as shown in below image.

Also create 2 Roles in Manage Roles Tab
Sales User and
HR User as shown in below image.

Step 4 : Assign roles to Users
As shown in below image
i) HR user is assigned with "HR user" role.
ii) Sales user is assigned with "Sales user" role.

Scenario :
CASE1) Give Access to CUBE 1 to User 1 who is assigned with Role1
i) Schema grant
ii) CUBE grant
iii) Hierarchy grant

Notes :
- Role Name in PSW should match with the role name in BA Server.
- Role Creation: In PSW "Sales User" role is created for Sales CUBE.
- Cube Grant: Right click on " Sales User" role and select "Add Cube Grant", give attributes : access =all , Cube=Sales
- Hierarchy Grant: Find below image.

- Member Grant: access=all , member=[Store].[USA].[CA]
- Another Member Grant: access=none , member=[Store].[USA].[CA].[Los Angeles]
- USA country in current example is having 3 states, CA,WA,OR.
- Out of these 3 states the access is given to only CA state.
- The cities other othn "Los Angeles" will be displayed with the other member grant.
1) login to the BA Server as "Sales" user.
2) New -> Saiku Analytics

CASE2) Give Access of CUBE 2 to User 2 who is assigned with Role2
As a demonstration just given CUBE Grant to "HR User".
"HR User" is the role name given in PSW as well role created in BA server.
For this role the user is "HR" in this example.

References :
1) http://mondrian.pentaho.com/documentation/schema.php#Defining_roles
2) http://infocenter.pentaho.com/help/index.jsp?topic=%2Fanalysis_guide%2Ftopic_mondrian_security.html
:-)
Sadakar
BI developer
Monday, February 16, 2015
Fill Colour of bar s based on a condition in Pentaho CDE
This post will talk about conditional colours of bars with below like scenarios.
Sample Scenario :
Print bar color as red when bar value <=2000
Print bar color as green when bar value >2000 and <10000
Print bar color as black when bar value>=10000
Scenario 2 :
When representing -Ve values on charts .. this kind of representation is preferable.
Code is Taken from Reference links :
function changeBars(){
var cccOptions = this.chartDefinition;
// For changing extension points, a little more work is required:
var eps = Dashboards.propertiesArrayToObject(cccOptions.extensionPoints);
// add extension points:
eps.bar_fillStyle = function getColor(){
var val = this.scene.vars.value.value;
if(val > 0 && val <= 5000){
return red;
}
else if(val > 5000 && val <= 50000){
return green;
}
else{
return black;
}
};
// Serialize back eps into cccOptions
cccOptions.extensionPoints = Dashboards.objectToPropertiesArray(eps);
}
NOTE : I have tried directly in Extension points but it did not work.
Sample output 1 :

function changeBars(){
var cccOptions = this.chartDefinition;
// For changing extension points, a little more work is required:
var eps = Dashboards.propertiesArrayToObject(cccOptions.extensionPoints);
// add extension points:
eps.bar_fillStyle = function getColor(){
var val = this.scene.vars.value.value;
if(val == 26297.2900){
return black;
}
else{
return blue;
}
};
// Serialize back eps into cccOptions
cccOptions.extensionPoints = Dashboards.objectToPropertiesArray(eps);
}

References :
http://translate.google.com/translate?&ie=UTF-8&sl=&tl=en&u=http://www.redopenbi.com/group/ctools/forum/topics/colores-en-bar-chart?commentId=2400100%3AComment%3A103280&xg_source=activity&groupId=2400100%3AGroup%3A73260
OR
http://www.redopenbi.com/group/ctools/forum/topics/colores-en-bar-chart?commentId=2400100%3AComment%3A103280&xg_source=activity&groupId=2400100%3AGroup%3A73260
OR
http://forums.pentaho.com/showthread.php?150582-Bar-chart-colors-dynamically-changed-based-on-data-value-Along-with-JavaScript-vars
Sample Scenario :
Print bar color as red when bar value <=2000
Print bar color as green when bar value >2000 and <10000
Print bar color as black when bar value>=10000
Scenario 2 :
When representing -Ve values on charts .. this kind of representation is preferable.
Code is Taken from Reference links :
function changeBars(){
var cccOptions = this.chartDefinition;
// For changing extension points, a little more work is required:
var eps = Dashboards.propertiesArrayToObject(cccOptions.extensionPoints);
// add extension points:
eps.bar_fillStyle = function getColor(){
var val = this.scene.vars.value.value;
if(val > 0 && val <= 5000){
return red;
}
else if(val > 5000 && val <= 50000){
return green;
}
else{
return black;
}
};
// Serialize back eps into cccOptions
cccOptions.extensionPoints = Dashboards.objectToPropertiesArray(eps);
}
NOTE : I have tried directly in Extension points but it did not work.
Sample output 1 :
Sample output 2 :
function changeBars(){
var cccOptions = this.chartDefinition;
// For changing extension points, a little more work is required:
var eps = Dashboards.propertiesArrayToObject(cccOptions.extensionPoints);
// add extension points:
eps.bar_fillStyle = function getColor(){
var val = this.scene.vars.value.value;
if(val == 26297.2900){
return black;
}
else{
return blue;
}
};
// Serialize back eps into cccOptions
cccOptions.extensionPoints = Dashboards.objectToPropertiesArray(eps);
}
References :
http://translate.google.com/translate?&ie=UTF-8&sl=&tl=en&u=http://www.redopenbi.com/group/ctools/forum/topics/colores-en-bar-chart?commentId=2400100%3AComment%3A103280&xg_source=activity&groupId=2400100%3AGroup%3A73260
OR
http://www.redopenbi.com/group/ctools/forum/topics/colores-en-bar-chart?commentId=2400100%3AComment%3A103280&xg_source=activity&groupId=2400100%3AGroup%3A73260
OR
http://forums.pentaho.com/showthread.php?150582-Bar-chart-colors-dynamically-changed-based-on-data-value-Along-with-JavaScript-vars
Sunday, February 15, 2015
Migrating data from Oracle database to Postgresql database using Pentaho Kettle
This post will talk about migrating data from Oracle database to Postgresql database.
The same can be doable from one database to another database.(i.e., for example MS-SQL server to postgreSQL).
Pentaho has its in built wizard tools to Migrate data from one database to another another database.
Find the below steps how we can use this in-buit tool in migrating.
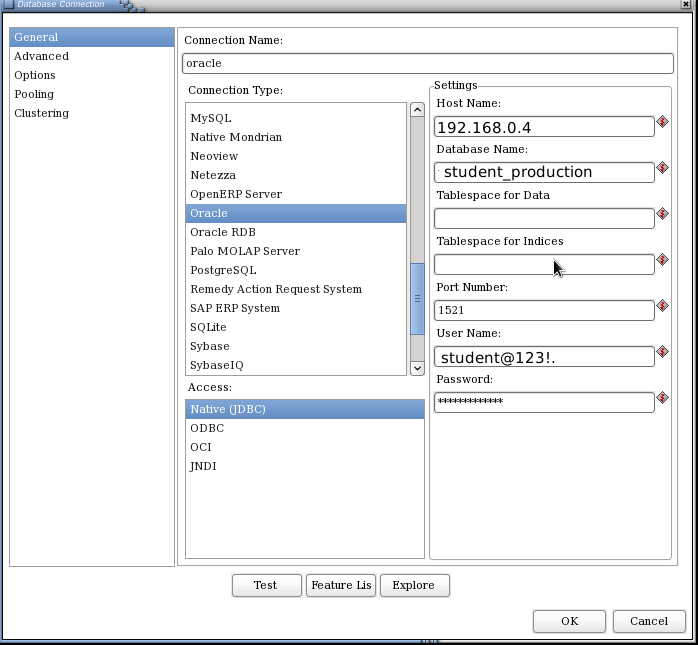
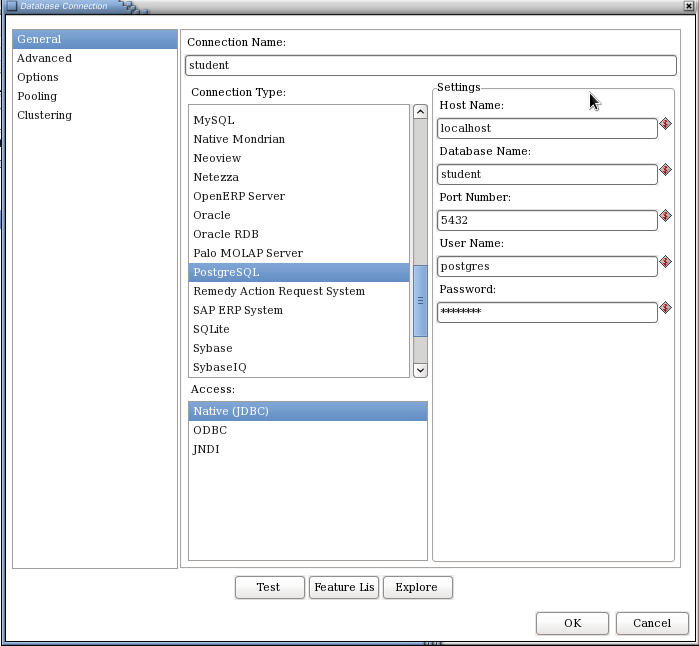
1) Create source database connection and target database connection.
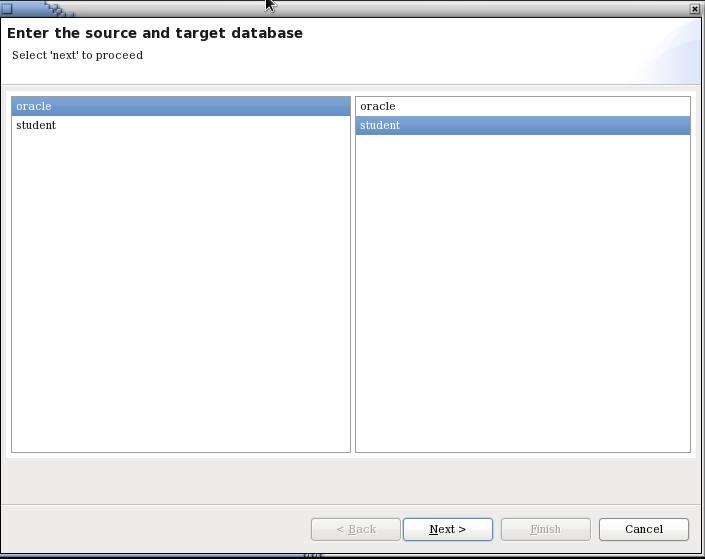
i.e., for example oralce connection as source and postgresql connection as target.
Go to Tools -> Wizard -> Create database connection.
Repeat the same for postgresql connection.
2) Go to Tools -> Wizard ->Copy Tables . Find the below images.
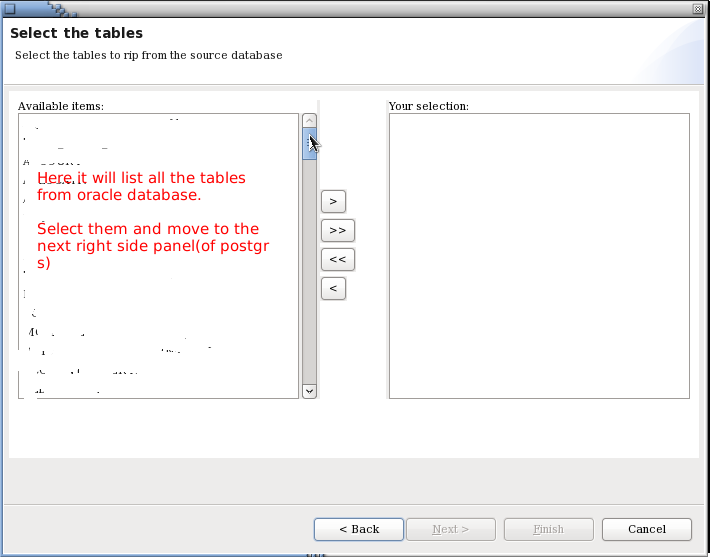
3) Itll create a job and “N” number of transformations based upon the number of tables in oracle database.
4) Run your job.. Thats all we have done.
Check the description & content of the tables in postgres.
References :
https://wiki.postgresql.org/wiki/Migrating_from_one_database_to_another_with_Pentaho_ETL
http://wiki.pentaho.com/display/COM/Using+the+Copy+Table+Wizard
http://wiki.pentaho.com/display/COM/Using+the+Copy+Table+Wizard
Saturday, February 14, 2015
Cascading parameters example in Pentaho CDE
Hi Guys,
It is quite easy to learn about cascading parameters in pentaho CDE dash boarding.
Example below teach you how to give cascading parameters on CDE dashboard.
Environment :
C-Tools 13.09
Pentaho BA Server 4.8 stableb
DB : postgreSQL foodmart ( jasperservers database)
IDEA of cascading parameters:


:-)
It is quite easy to learn about cascading parameters in pentaho CDE dash boarding.
Example below teach you how to give cascading parameters on CDE dashboard.
Environment :
C-Tools 13.09
Pentaho BA Server 4.8 stableb
DB : postgreSQL foodmart ( jasperservers database)
IDEA of cascading parameters:
Example:
1) Lay out section
* Design your lay out for keeping the parameters on dasbharod.
* Sample reference design of layout.
2) Components section
* You need to define 3 selects for 3 parameters
* You need to define 3 parameters
* Observer the Sample worked out image below
*
* Define 2 parameters for country and state(paramCountry and paramState)
* Define 3 Selects for displaying the selection of parameters on dashboard.
( CountrySelectComponent, StateSelectComponent, CitySelectComponent)
Parameters
1. ParamCountry
i.e, Name= paramCountry and Propertyvalue=USA(default value)
2. paramState
Name=paramState and Propertyvalue=OR(default value)
NOTE : you need NOT to create parameter for city in this case.
Select Components
* Select components are used to display the data coming from sequel query on dashboard as drop down list at the respected place holders.
1) CountrySelectComponent
Name: CountrySelecte Component
Parameter: paramCouentry (you should give param name otherwise, it wont work)
Datasource: give the query name (will discussion in Datasource selection)
HtmlObject : countrySelect
2)StateSelectComponent
Name: StateSelectComponent
Parameter : paramState
Listners : paramCountry
Parameters : Arg(paramCountry) and val(paramCountryP)
Datasource : queryState
HtmlObject : stateSelect
3) CitySelectComponent
* You need add two listners and two parameters at Listerns and parameters properties
Name;CitySelectComponent
Parameter : No need to give any parameters name here as we are not using parameter for city sleelct
Listners : paramState,paramCountry
Parameters :
Arg(paramCountry) and val(paramCountry)
Arg(paramState) and val(paramState)
Datasource : queryCity
HtmlObject : citySelect
3) Data Sources section:
Write queries for 3 selects
1) queryCountry(above image)
Name: queryCountry
Driver: org.postgresql.Driver
User name : postgres
Password : postgres
URL : jdbc:postgresql://localhost:6062/foodmart (5432 is the default port number for postgreSQL)
Query: SELECT DISTINCT country from customer
Parameters : paramCountry(arg) and paramCountry(val)
2) queryState(image is not shown in post refere queryCountry image)
Name: queryState
Driver: org.postgresql.Driver
User name : postgres
Password : postgres
URL : jdbc:postgresql://localhost:6062/foodmart (5432 is the default port number for postgreSQL)
Query: SELECT DISTINCT state_province from customer where country=${paramCountry}
Parameters : paramCountry(arg) and paramCountry(val)
3) queryCity(image is not shown in post refere queryCountry image)
Name: queryCity
Driver: org.postgresql.Driver
User name : postgres
Password : postgres
URL : jdbc:postgresql://localhost:6062/foodmart (5432 is the default port number for postgreSQL)
Query: SELECT DISTINCT city from customer WHERE country=${paramCountry} AND state_province=${paramState}
Parameters : paramCountry(arg) and paramCountry(val)
paramState(arg) and paramState(val)
Save the dashboard and see the preview.
Final output:
1) Test 1
2) Test2
Thank you for reading this post :) :)
for queries and suggestions : sadakar.1988@gmail.com
SOURCE CODE OF THIS EXAMPLE:
https://drive.google.com/file/d/0BymV_QP4TGBEZGhpb1hySDBoSEE/edit?usp=sharing
Toggle between two Divs for Pentaho CDE Charts
This post will cover the toggling among the charts.
i.e., Share one place holder for multiple charts by providing a link or a button.
Example developed on :
C-Tools of 14.07.29, foodmart of postgresql, pentaho 5.0.1 CE stable.
Step 1 : Layout section.
1) Save the dashboard in bootstrap mode.
2) Row ->Column->Html
In Html write below code :
<p><a href="#" id="link">Show B</a></p>
<div id="a"></div>
<div id="b"></div>
<script type="text/javascript">
var $divA = $(#a),
$divB = $(#b),
$link = $(#link);
// Initialize everything
$link.text( Pie );
$divA.hide();
$link.click(function(){
// If A is visible when the link is clicked
// you need to hide A and show B
if( $divA.is( :visible ) ){
$link.text( Pie );
$divA.hide();
$divB.show();
} else {
$link.text( Bar );
$divA.show();
$divB.hide();
}
return false;
});
</script>
Step 2: Data Sources section
1) Give all the connection details.
Name : query1
URL : jdbc:postgresql://localhost:5432/foodmart
Driver : org.postgresql.Driver
Username/Password : postgres/postgres
Query :
SELECT * FROM
(
SELECT
DISTINCT brand_name AS "Brand Name",
SUM(unit_sales) AS "Sales"
FROM product p
INNER JOIN sales_fact_1997 sf7
ON p.product_id=sf7.product_id
INNER JOIN time_by_day t
ON sf7.time_id=t.time_id
WHERE
(
to_char(t.the_date,YYYY-MM-DD)>=2012-01-01
AND
to_char(t.the_date,YYYY-MM-DD)<=2012-01-07
)
GROUP BY "Brand Name"
ORDER BY SUM(unit_sales) DESC
limit 5
)table1
Step 3 : Components section
1) Take pie chart & bar chart.
2) Set all the properties like name, htmlObject (for pie take "a" as htmlObject and for bar chart "b" as htmlObject).
3) Save your dashboard and see the preview.
Sample output:
Image 1 : Pie Chart.

Image 2 : Perform click action on Pie you will get bar chart in place of pie chart that means you are toggling b/w two chart (i.e., Single place holder is sharing by two charts and the logic of two divs applied for CDE charts).

Download example here : Click Me
References :
1) http://jsfiddle.net/QAxgD/
2) http://stackoverflow.com/questions/18110320/toggle-between-two-divs
3) http://forums.pentaho.com/showthread.php?170449-How-To-Toaggle-Between-Chart-amp-Grid
i.e., Share one place holder for multiple charts by providing a link or a button.
Example developed on :
C-Tools of 14.07.29, foodmart of postgresql, pentaho 5.0.1 CE stable.
Step 1 : Layout section.
1) Save the dashboard in bootstrap mode.
2) Row ->Column->Html
In Html write below code :
<p><a href="#" id="link">Show B</a></p>
<div id="a"></div>
<div id="b"></div>
<script type="text/javascript">
var $divA = $(#a),
$divB = $(#b),
$link = $(#link);
// Initialize everything
$link.text( Pie );
$divA.hide();
$link.click(function(){
// If A is visible when the link is clicked
// you need to hide A and show B
if( $divA.is( :visible ) ){
$link.text( Pie );
$divA.hide();
$divB.show();
} else {
$link.text( Bar );
$divA.show();
$divB.hide();
}
return false;
});
</script>
Step 2: Data Sources section
1) Give all the connection details.
Name : query1
URL : jdbc:postgresql://localhost:5432/foodmart
Driver : org.postgresql.Driver
Username/Password : postgres/postgres
Query :
SELECT * FROM
(
SELECT
DISTINCT brand_name AS "Brand Name",
SUM(unit_sales) AS "Sales"
FROM product p
INNER JOIN sales_fact_1997 sf7
ON p.product_id=sf7.product_id
INNER JOIN time_by_day t
ON sf7.time_id=t.time_id
WHERE
(
to_char(t.the_date,YYYY-MM-DD)>=2012-01-01
AND
to_char(t.the_date,YYYY-MM-DD)<=2012-01-07
)
GROUP BY "Brand Name"
ORDER BY SUM(unit_sales) DESC
limit 5
)table1
Step 3 : Components section
1) Take pie chart & bar chart.
2) Set all the properties like name, htmlObject (for pie take "a" as htmlObject and for bar chart "b" as htmlObject).
3) Save your dashboard and see the preview.
Sample output:
Image 1 : Pie Chart.
Image 2 : Perform click action on Pie you will get bar chart in place of pie chart that means you are toggling b/w two chart (i.e., Single place holder is sharing by two charts and the logic of two divs applied for CDE charts).
Download example here : Click Me
References :
1) http://jsfiddle.net/QAxgD/
2) http://stackoverflow.com/questions/18110320/toggle-between-two-divs
3) http://forums.pentaho.com/showthread.php?170449-How-To-Toaggle-Between-Chart-amp-Grid
Thursday, February 12, 2015
Bar chart with Target lines in pentaho CDE making bars as lines using java script in pentaho CDE
Hi guys,
This post teach you how to make bars as lines in pentaho CDE.
Source for this post is : http://jsfiddle.net/duarteleao/7maGD/
and http://type-exit.org/adventures-with-open-source-bi/2011/06/creating-dashboards-with-cde/
Scenario : Some end users wants visualization of grouped bars as lines where one of the bar is as bar and remaining bars as targeted lines on the same bar.
Properties have to give:
Plot2 : True
Find the remaining properties in below image: version of CDE is : 13.06 but will work in higher versions also.
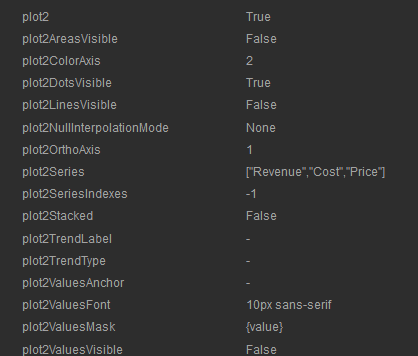
NOTE: Find the image for how to give the above code as properties in Extension points of chart component.
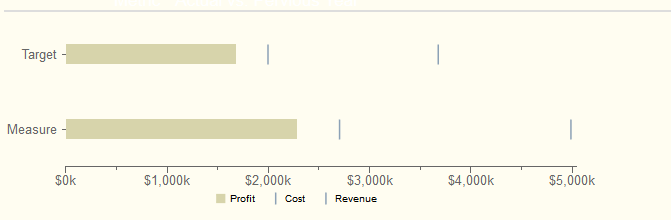
Sample output of the chart on dashboard after giving the above properties.
Sadakar
BI developer
("Learning never exhausts the mind")
This post teach you how to make bars as lines in pentaho CDE.
Source for this post is : http://jsfiddle.net/duarteleao/7maGD/
and http://type-exit.org/adventures-with-open-source-bi/2011/06/creating-dashboards-with-cde/
Scenario : Some end users wants visualization of grouped bars as lines where one of the bar is as bar and remaining bars as targeted lines on the same bar.
Properties have to give:
Plot2 : True
Find the remaining properties in below image: version of CDE is : 13.06 but will work in higher versions also.
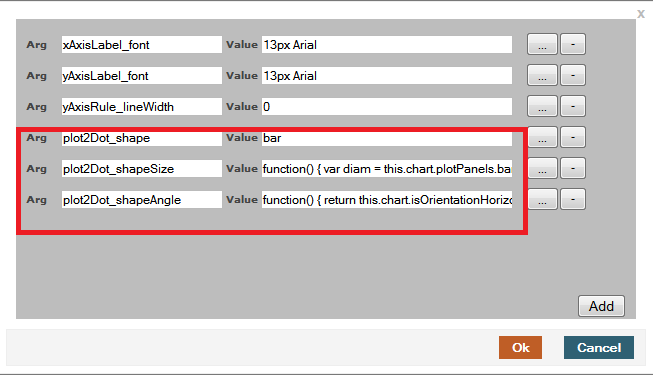
In "Extension points" for the chart component you need to give 3 properties from the first link.
They are
extensionPoints: {
plot2Dot_shape: bar,
plot2Dot_shapeSize: function() {
var diam = this.chart.plotPanels.bar.barWidth ||
this.chart.options.barSizeMax;
return this.finished(diam);
},
plot2Dot_shapeAngle: function() {
return this.chart.isOrientationHorizontal() ? 0 : -Math.PI/2;
}
plot2Dot_shape: bar,
plot2Dot_shapeSize: function() {
var diam = this.chart.plotPanels.bar.barWidth ||
this.chart.options.barSizeMax;
return this.finished(diam);
},
plot2Dot_shapeAngle: function() {
return this.chart.isOrientationHorizontal() ? 0 : -Math.PI/2;
}
NOTE: Find the image for how to give the above code as properties in Extension points of chart component.
Sample output of the chart on dashboard after giving the above properties.
Sadakar
BI developer
("Learning never exhausts the mind")
Wednesday, February 11, 2015
Tip Remove Disable Edit Option Mode For wcdf CDE Files in Pentaho 5 x Production Community Server
Hi Guys,
Below tip is used for disable Edit Mode of CDE dashboards ..
When this is useful ?
CASE 1 :
If you are not going for Embedding BI to integrate the CDE dashboards.
CASE 2:
If you dont want your end user to open the CDE file to view the CODE.. If you are using the Server itself in your end client location he/she also may not need all these except logging into the server and see the dashboards...
For doing this.. i.e., to disable the Edit mode of CDE dashboards, you just need to comment below code in plugin.xml file of pentaho-cdf-dd folder.
File location : /home/sadakar/softwares installed/Pentaho/biserver-ce/pentaho-solutions/system/pentaho-cdf-dd
<!--
<operation>
<id>EDIT</id>
<perspective>wcdf.edit</perspective>
</operation>
-->
Sample Image:

NOTE: As it is a configuration file, you need to restart the server once the changes done to it.
Another Imp NOTE:
As C-Tools(CDE,CDF,CDA) are uneatable from Marketplace, and if you go for any upgrade of them then you might lost this configuration.. what itll do internally when you upgrade to new versions of C-Tools, internally itll uninstall the plug-ins and then download the new.. hence as you will get a fresh copy you there might be a chance of losing your settings.. This is not tested..
Thank you :-)
Sadakar
BI developer
Pentaho/Jasper/Talend ETL
Below tip is used for disable Edit Mode of CDE dashboards ..
When this is useful ?
CASE 1 :
If you are not going for Embedding BI to integrate the CDE dashboards.
CASE 2:
If you dont want your end user to open the CDE file to view the CODE.. If you are using the Server itself in your end client location he/she also may not need all these except logging into the server and see the dashboards...
For doing this.. i.e., to disable the Edit mode of CDE dashboards, you just need to comment below code in plugin.xml file of pentaho-cdf-dd folder.
File location : /home/sadakar/softwares installed/Pentaho/biserver-ce/pentaho-solutions/system/pentaho-cdf-dd
<!--
<operation>
<id>EDIT</id>
<perspective>wcdf.edit</perspective>
</operation>
-->
Sample Image:
NOTE: As it is a configuration file, you need to restart the server once the changes done to it.
Another Imp NOTE:
As C-Tools(CDE,CDF,CDA) are uneatable from Marketplace, and if you go for any upgrade of them then you might lost this configuration.. what itll do internally when you upgrade to new versions of C-Tools, internally itll uninstall the plug-ins and then download the new.. hence as you will get a fresh copy you there might be a chance of losing your settings.. This is not tested..
Thank you :-)
Sadakar
BI developer
Pentaho/Jasper/Talend ETL
Tuesday, February 10, 2015
Kettle transformation as data source in Pentaho CDE OR Excel sheet as data source for pentaho CDE dashboard
Hello Guys..
Scenario :
If you receive excel sheet or csv file as data source then how to create dashboard charts or tables in pentaho CDE ?
Like jasper here we do not have any direct way to connect excel sheet as a data source. Here in Pentaho suite we need to make use of Kettle(PDI) to work out with Excel or CSV data sources.
Current post is an example of using Excel data source for Pentaho CDE dashboard.
This post is not using any parameters(Need to work out with parameters and update this blog post).
Aim of the Example:
Creating dashboard charts using Excel Datasheet
Environment :
1) PDI(Kettlle)- 4.4 stable
2) Pentaho BA server - 4.8 stable
3) Excel data source(with .xls extension)
4) Pentaho C-Tools(13.09 version)
5) Web browser(Mozilla is preferable)
Example :
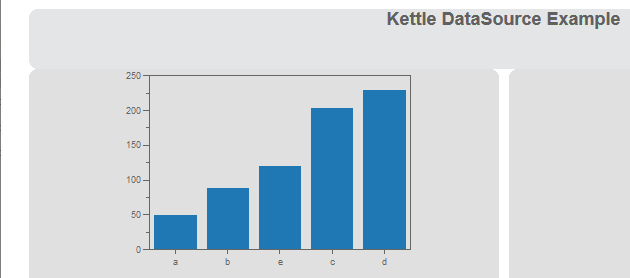
Displaying bar chart group by summation of ranks in ascending order. (just an example data sheet)
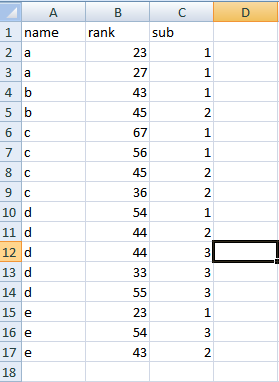
Display names on X-axis and summation of ranks on Y-axis on Pentaho CDE chart...
Data display should be grouped by name .
Data display should be grouped by name .
NOTE:
Save your kettle file in the folder where you also saving the CDE files.
i.e., Generally in 4.8 BA server
under pentaho-solutions/your project(dashboard) folder. Bz you need to pick the developed .ktr file from data sources section.
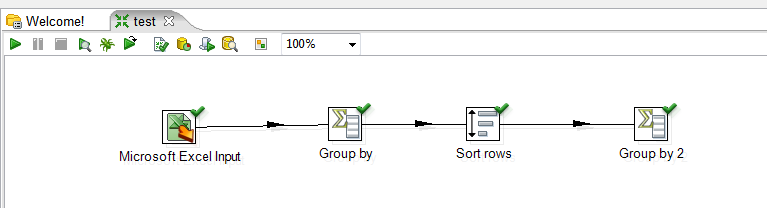
Steps:1 Working with PDI for Excel Data
1) Drag an drop Excel Input step.
Design-> Input -> Microsoft Excel Input ->
2) Double click on Microsoft Excel Input step and Browse for your excel file and then Add.
3) Drag and drop "Group By" step from Design->Statistics
Double click on it and select Group field as name
In the aggregates select as below
Name Subject Type Value
name rank Sum
4) Connect the two Steps( i.e., connect "Microsoft Excel Input" and "Group By" with an Hop.
5) See the preview (Use Debug this transformation).
6) Sort the output that you got from step 5.
Drag and drop "Sort rows" step from Design ->Transform.
connect "Group By" step to "Sort rows" step using a hop.
7) After sorting add another step say "Group By 2" to your transformation and now see the preview of the transformation.
Kettle Design Image:
Down load source code of this example here
References :
1) Drag an drop Excel Input step.
Design-> Input -> Microsoft Excel Input ->
2) Double click on Microsoft Excel Input step and Browse for your excel file and then Add.
3) Drag and drop "Group By" step from Design->Statistics
Double click on it and select Group field as name
In the aggregates select as below
Name Subject Type Value
name rank Sum
4) Connect the two Steps( i.e., connect "Microsoft Excel Input" and "Group By" with an Hop.
5) See the preview (Use Debug this transformation).
6) Sort the output that you got from step 5.
Drag and drop "Sort rows" step from Design ->Transform.
connect "Group By" step to "Sort rows" step using a hop.
7) After sorting add another step say "Group By 2" to your transformation and now see the preview of the transformation.
Kettle Design Image:
Step 2: Kettle Transformation as Data source in pentaho CDE
1) Layout section :
Design and develop your dashboard as per your requirement.
2) Components section:
Take a bar chart and give place holder for that using html object
3) Data sources section:
i) Select "KETTLE Queries" and then click on "kettle over kettle TransFromFile"
ii) Give name and locate your .ktr file and then write the step name from where you are getting output in your transformation.. In this example step name is : Group by 2 (note that white spaces are there in name)
iii) Give the name of this data source in component section for your chart data source.
Thats it. you have done with working with Kettle as data source for pentaho CDE dashboarding.
Sample output of this example
Down load source code of this example here
References :
1) http://codeissue.com/articles/a04f273a99579d2/
Pedros blog post:
2) http://pedroalves-bi.blogspot.in/2011/07/elasticsearch-kettle-and-ctools.html
Pedros blog post:
2) http://pedroalves-bi.blogspot.in/2011/07/elasticsearch-kettle-and-ctools.html
Subscribe to:
Posts (Atom)