Thursday, February 12, 2015
Bar chart with Target lines in pentaho CDE making bars as lines using java script in pentaho CDE
Hi guys,
This post teach you how to make bars as lines in pentaho CDE.
Source for this post is : http://jsfiddle.net/duarteleao/7maGD/
and http://type-exit.org/adventures-with-open-source-bi/2011/06/creating-dashboards-with-cde/
Scenario : Some end users wants visualization of grouped bars as lines where one of the bar is as bar and remaining bars as targeted lines on the same bar.
Properties have to give:
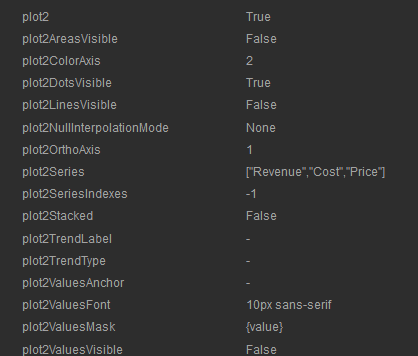
Plot2 : True
Find the remaining properties in below image: version of CDE is : 13.06 but will work in higher versions also.
NOTE: Find the image for how to give the above code as properties in Extension points of chart component.
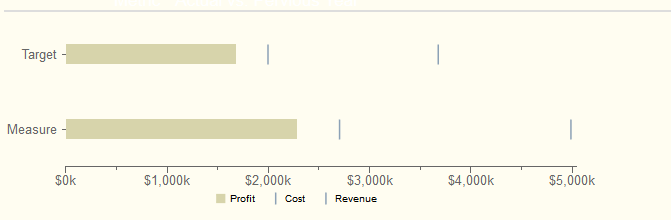
Sample output of the chart on dashboard after giving the above properties.
Sadakar
BI developer
("Learning never exhausts the mind")
This post teach you how to make bars as lines in pentaho CDE.
Source for this post is : http://jsfiddle.net/duarteleao/7maGD/
and http://type-exit.org/adventures-with-open-source-bi/2011/06/creating-dashboards-with-cde/
Scenario : Some end users wants visualization of grouped bars as lines where one of the bar is as bar and remaining bars as targeted lines on the same bar.
Properties have to give:
Plot2 : True
Find the remaining properties in below image: version of CDE is : 13.06 but will work in higher versions also.
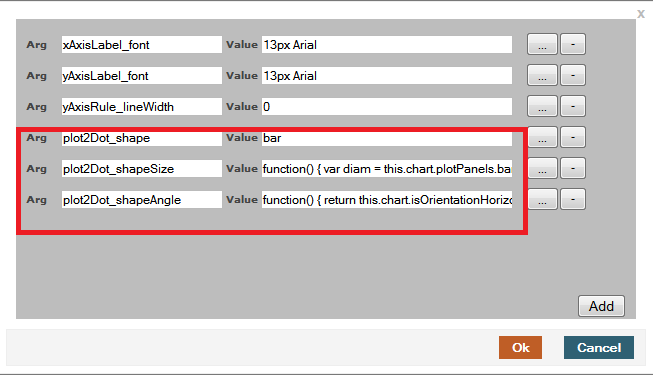
In "Extension points" for the chart component you need to give 3 properties from the first link.
They are
extensionPoints: {
plot2Dot_shape: bar,
plot2Dot_shapeSize: function() {
var diam = this.chart.plotPanels.bar.barWidth ||
this.chart.options.barSizeMax;
return this.finished(diam);
},
plot2Dot_shapeAngle: function() {
return this.chart.isOrientationHorizontal() ? 0 : -Math.PI/2;
}
plot2Dot_shape: bar,
plot2Dot_shapeSize: function() {
var diam = this.chart.plotPanels.bar.barWidth ||
this.chart.options.barSizeMax;
return this.finished(diam);
},
plot2Dot_shapeAngle: function() {
return this.chart.isOrientationHorizontal() ? 0 : -Math.PI/2;
}
NOTE: Find the image for how to give the above code as properties in Extension points of chart component.
Sample output of the chart on dashboard after giving the above properties.
Sadakar
BI developer
("Learning never exhausts the mind")
Subscribe to:
Post Comments (Atom)
No comments:
Post a Comment
Note: Only a member of this blog may post a comment.