Showing posts with label making. Show all posts
Showing posts with label making. Show all posts
Wednesday, February 18, 2015
Pentaho Opensource 5 0 1 stable Vs Jasper Professional 5 5 BA Server Tool selection decision making points on 3 categories
Hello Guys,
Here is a small document prepared on differentiating Pentaho Open source Vs Jasper Professional.
Based on the below information one can take decision on tool selection for BI needs.
I would like to present a clear picture with insight & readers of this document are encouraged to add your points in the comment box..
IMP NOTE: Remember , I am comparing the Pentaho Open source(Community) 5.0.1 stable with Jasper Professional(licensed) 5.5
Dashboards :
| Key feaute | Pentaho Open source Dashboard | Jasper Professional dashboard |
| Tool | Community Tools(C-Tools) – Server plug ins CDE(Community Dashboard Editor) CDF(Community Dashboard Framework) CDA(Community Data Access) | iReport/Jasper Studio Desktop stand alone tools |
| Development of Reports done at | Fly on the server itself | Depends on stand alone designing tools & need to publish to the server and again need to design the dashboard |
| Responsiveness /Mobile support | Responsiveness is achievable using bootstrap css framework | Lack of responsiveness even though there is Proprtional property of the dashboard designer |
| Dashboards output end view-able devices | Compatible with Mobile/iPad/laptop/Desktop/TV like big screens | Compatible with laptop/desktop |
| Charts | Protovis charts implemented, extend able to D3 charts.. can integrate fusion and HTML charts also. | Embedded charts engines – Jfree, Fusion & HTML5 charts. Can integrate protovis/D3 charts using html component of iReport/Jasper Studio |
| Loading of charts on the dashboard | Will take lesser time using Pentahos powerful caching mechanism | Will take longer time to load the charts on the dashboard |
| Embedding BI | Achievable using iframe tags | Achievable using iframe tags |
| Community support | Active | Active as it is a professional .. general community is not so active |
| Interactivity/Drill down/ Inter charts(frames) communication | Achievable | Achievable |
| Multi-tenancy | Need to check (will update on this) | Achievable |
| Customization | Developer friendly | Not developer friendly |
| Download here | Pentaho Maket Place or install using ctools-installer.sh http://community.pentaho.com/ | Purchase license https://www.jaspersoft.com/jaspersoft-business-intelligence-software-trial |
Analysis : OLAP Cubes
| Key feature | Pentaho Open source Analysis | Jasper Opensource/Pro Analysis | |
| Desktop Stand alone Development Tool | Pentaho Schema workbench | Schema Workbench | |
| Front End tool to view the output | Pviot4J Analytics (or) Saiku Analytics (or) JPivot View (or) BTable (or) Ivy Schema Editor | JPivot View | |
| Ad-hoc Reporting on Cube ouptut | Yes, using Saiku Analytics | Ad-hoc Editor (For jasper pro & enterprise it is an add-on feature. http://www.jaspersoft.com/editions | |
| Query Language | MDX ( Multi Dimensional Expression) | MDX (Mullti Dimensional Expression) | |
| Caching | Enabled – Very fast access of data | Enabled – some what less speed when compared with pentaho server | |
| Community Support | Very Active – Quick Responses | Not so active as it is not a owned product of jasper/tibco | |
| Documentation | Online documentation available with examples | Online pdf documentation is available with Examples |
Ad-hoc Reporting
| Key feature | Pentaho Open source Ad-hoc | Pentaho Enterprise Ad-hoc | Jasper Pro Ad-hoc |
| Source for ad-hoc reporting | Meta data layer creation | Meta data layer creation | Create topics OR Create Domains |
| Tool | Pentaho Meta Data Editor(PME) (Stand alone desktop tool) (OR ) Create JOINS on the fly on the server and use it for ad-hoc reporting | PME | No desktop tool.. directly in the server create Domains OR topics |
| Output Server tools | WAQR – Web Ad-hoc Query and Reporting (OR) Saiku Reporting compatible with 4.8 server as of now | Interactive Reporting - Advanced of WAQR But WAQR is not supported by any more Interactive reporting is an extension of WAQR in Enterprise Version of pentaho | Jasper Ad-hoc Editor |
| Support | Deprecated – No longer supported by penatho | On demand support | On demand – Need to be jasper customer |
| Visualization of Data in the form of charts | No | No | Yes .. using Ad-hoc report output visualization of data in the form of selected charts . |
Readers of this post is encouraged to add your points/suggestions in comment box..
Thank you.
Sadakar
BI developer

Thursday, February 12, 2015
Bar chart with Target lines in pentaho CDE making bars as lines using java script in pentaho CDE
Hi guys,
This post teach you how to make bars as lines in pentaho CDE.
Source for this post is : http://jsfiddle.net/duarteleao/7maGD/
and http://type-exit.org/adventures-with-open-source-bi/2011/06/creating-dashboards-with-cde/
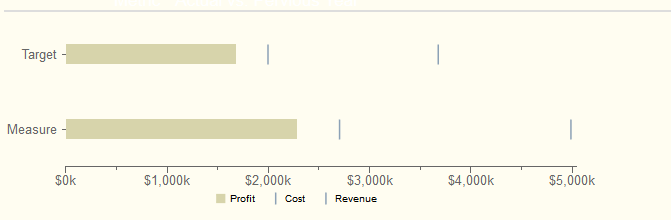
Scenario : Some end users wants visualization of grouped bars as lines where one of the bar is as bar and remaining bars as targeted lines on the same bar.
Properties have to give:
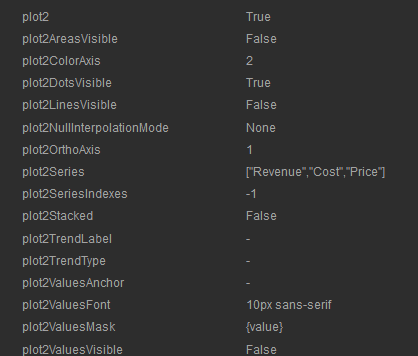
Plot2 : True
Find the remaining properties in below image: version of CDE is : 13.06 but will work in higher versions also.
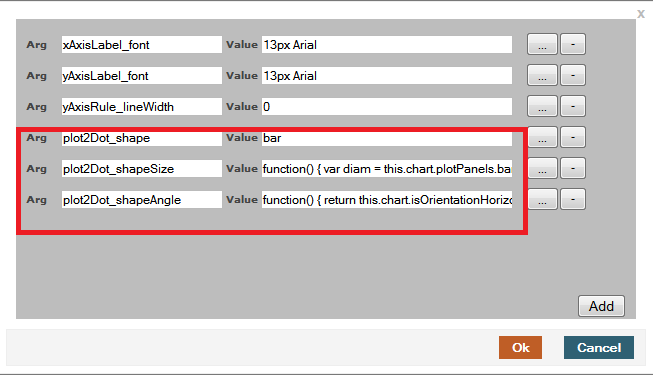
NOTE: Find the image for how to give the above code as properties in Extension points of chart component.
Sample output of the chart on dashboard after giving the above properties.
Sadakar
BI developer
("Learning never exhausts the mind")
This post teach you how to make bars as lines in pentaho CDE.
Source for this post is : http://jsfiddle.net/duarteleao/7maGD/
and http://type-exit.org/adventures-with-open-source-bi/2011/06/creating-dashboards-with-cde/
Scenario : Some end users wants visualization of grouped bars as lines where one of the bar is as bar and remaining bars as targeted lines on the same bar.
Properties have to give:
Plot2 : True
Find the remaining properties in below image: version of CDE is : 13.06 but will work in higher versions also.
In "Extension points" for the chart component you need to give 3 properties from the first link.
They are
extensionPoints: {
plot2Dot_shape: bar,
plot2Dot_shapeSize: function() {
var diam = this.chart.plotPanels.bar.barWidth ||
this.chart.options.barSizeMax;
return this.finished(diam);
},
plot2Dot_shapeAngle: function() {
return this.chart.isOrientationHorizontal() ? 0 : -Math.PI/2;
}
plot2Dot_shape: bar,
plot2Dot_shapeSize: function() {
var diam = this.chart.plotPanels.bar.barWidth ||
this.chart.options.barSizeMax;
return this.finished(diam);
},
plot2Dot_shapeAngle: function() {
return this.chart.isOrientationHorizontal() ? 0 : -Math.PI/2;
}
NOTE: Find the image for how to give the above code as properties in Extension points of chart component.
Sample output of the chart on dashboard after giving the above properties.
Sadakar
BI developer
("Learning never exhausts the mind")
Subscribe to:
Posts (Atom)