Tuesday, March 10, 2015
Deprecating ScriptDB and Domain Service in Apps Script
In the last few months, weve added a number of new features to Google Apps Script, including add-ons for Sheets and Docs and 7 new advanced services.
Were eager to maintain that momentum — focusing on new features that help you do more with Google Apps. As a result, were deprecating two Apps Script services for which good replacements exist elsewhere: ScriptDB (a NoSQL database that has been marked as experimental since it was introduced) and the Domain service (which encapsulates the GroupsManager, NicknameManager, and UserManager global objects).
Both ScriptDB and the Domain service will be turned off on November 20, 2014.
Before then, youll need to port any ScriptDB projects to another data store, like Google Cloud SQL or a third-party NoSQL database. Weve created a migration guide that explains how to export your data from ScriptDB and suggests a few alternate data stores. We have also improved the documentation for connecting to external databases through JDBC to make it a little easier for you to set up Cloud SQL with Apps Script.
The Domain service, which only Google Apps domain administrators can use, is replaced by the recently added Admin SDK Directory and Admin SDK Reports advanced services. Those advanced services also provide many new features that the Domain service does not — like managing users devices, OAuth tokens, and application-specific passwords — so we expect that youll prefer using them in the future.
 | Saurabh Gupta profile | twitter | blog As the product manager for Google Apps Script, Saurabh is responsible for Apps Script’s overall vision and direction. |

Thursday, February 12, 2015
Bar chart with Target lines in pentaho CDE making bars as lines using java script in pentaho CDE
This post teach you how to make bars as lines in pentaho CDE.
Source for this post is : http://jsfiddle.net/duarteleao/7maGD/
and http://type-exit.org/adventures-with-open-source-bi/2011/06/creating-dashboards-with-cde/
Scenario : Some end users wants visualization of grouped bars as lines where one of the bar is as bar and remaining bars as targeted lines on the same bar.
Properties have to give:
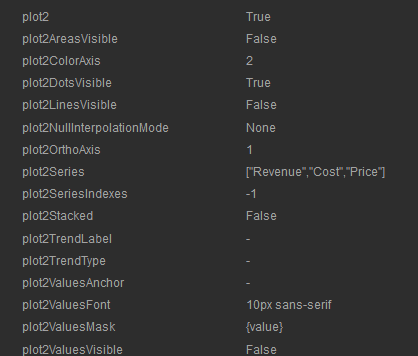
Plot2 : True
Find the remaining properties in below image: version of CDE is : 13.06 but will work in higher versions also.
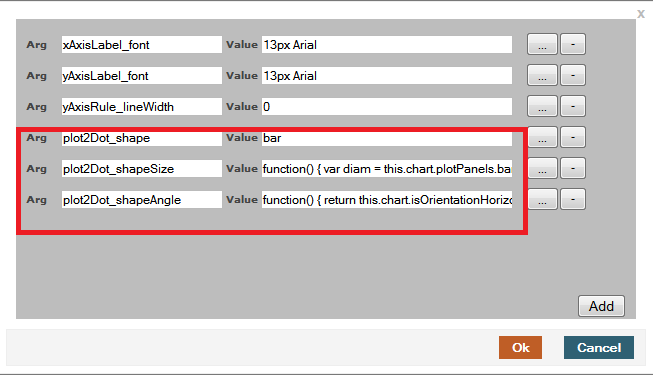
plot2Dot_shape: bar,
plot2Dot_shapeSize: function() {
var diam = this.chart.plotPanels.bar.barWidth ||
this.chart.options.barSizeMax;
return this.finished(diam);
},
plot2Dot_shapeAngle: function() {
return this.chart.isOrientationHorizontal() ? 0 : -Math.PI/2;
}
NOTE: Find the image for how to give the above code as properties in Extension points of chart component.
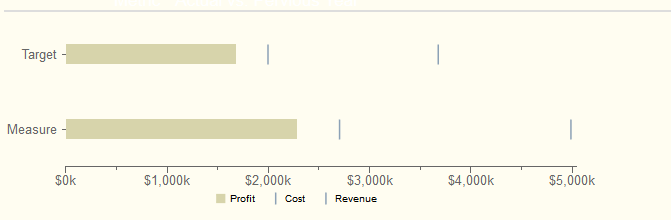
Sample output of the chart on dashboard after giving the above properties.
Sadakar
BI developer
("Learning never exhausts the mind")