Showing posts with label on. Show all posts
Showing posts with label on. Show all posts
Wednesday, February 18, 2015
Pentaho Opensource 5 0 1 stable Vs Jasper Professional 5 5 BA Server Tool selection decision making points on 3 categories
Hello Guys,
Here is a small document prepared on differentiating Pentaho Open source Vs Jasper Professional.
Based on the below information one can take decision on tool selection for BI needs.
I would like to present a clear picture with insight & readers of this document are encouraged to add your points in the comment box..
IMP NOTE: Remember , I am comparing the Pentaho Open source(Community) 5.0.1 stable with Jasper Professional(licensed) 5.5
Dashboards :
| Key feaute | Pentaho Open source Dashboard | Jasper Professional dashboard |
| Tool | Community Tools(C-Tools) – Server plug ins CDE(Community Dashboard Editor) CDF(Community Dashboard Framework) CDA(Community Data Access) | iReport/Jasper Studio Desktop stand alone tools |
| Development of Reports done at | Fly on the server itself | Depends on stand alone designing tools & need to publish to the server and again need to design the dashboard |
| Responsiveness /Mobile support | Responsiveness is achievable using bootstrap css framework | Lack of responsiveness even though there is Proprtional property of the dashboard designer |
| Dashboards output end view-able devices | Compatible with Mobile/iPad/laptop/Desktop/TV like big screens | Compatible with laptop/desktop |
| Charts | Protovis charts implemented, extend able to D3 charts.. can integrate fusion and HTML charts also. | Embedded charts engines – Jfree, Fusion & HTML5 charts. Can integrate protovis/D3 charts using html component of iReport/Jasper Studio |
| Loading of charts on the dashboard | Will take lesser time using Pentahos powerful caching mechanism | Will take longer time to load the charts on the dashboard |
| Embedding BI | Achievable using iframe tags | Achievable using iframe tags |
| Community support | Active | Active as it is a professional .. general community is not so active |
| Interactivity/Drill down/ Inter charts(frames) communication | Achievable | Achievable |
| Multi-tenancy | Need to check (will update on this) | Achievable |
| Customization | Developer friendly | Not developer friendly |
| Download here | Pentaho Maket Place or install using ctools-installer.sh http://community.pentaho.com/ | Purchase license https://www.jaspersoft.com/jaspersoft-business-intelligence-software-trial |
Analysis : OLAP Cubes
| Key feature | Pentaho Open source Analysis | Jasper Opensource/Pro Analysis | |
| Desktop Stand alone Development Tool | Pentaho Schema workbench | Schema Workbench | |
| Front End tool to view the output | Pviot4J Analytics (or) Saiku Analytics (or) JPivot View (or) BTable (or) Ivy Schema Editor | JPivot View | |
| Ad-hoc Reporting on Cube ouptut | Yes, using Saiku Analytics | Ad-hoc Editor (For jasper pro & enterprise it is an add-on feature. http://www.jaspersoft.com/editions | |
| Query Language | MDX ( Multi Dimensional Expression) | MDX (Mullti Dimensional Expression) | |
| Caching | Enabled – Very fast access of data | Enabled – some what less speed when compared with pentaho server | |
| Community Support | Very Active – Quick Responses | Not so active as it is not a owned product of jasper/tibco | |
| Documentation | Online documentation available with examples | Online pdf documentation is available with Examples |
Ad-hoc Reporting
| Key feature | Pentaho Open source Ad-hoc | Pentaho Enterprise Ad-hoc | Jasper Pro Ad-hoc |
| Source for ad-hoc reporting | Meta data layer creation | Meta data layer creation | Create topics OR Create Domains |
| Tool | Pentaho Meta Data Editor(PME) (Stand alone desktop tool) (OR ) Create JOINS on the fly on the server and use it for ad-hoc reporting | PME | No desktop tool.. directly in the server create Domains OR topics |
| Output Server tools | WAQR – Web Ad-hoc Query and Reporting (OR) Saiku Reporting compatible with 4.8 server as of now | Interactive Reporting - Advanced of WAQR But WAQR is not supported by any more Interactive reporting is an extension of WAQR in Enterprise Version of pentaho | Jasper Ad-hoc Editor |
| Support | Deprecated – No longer supported by penatho | On demand support | On demand – Need to be jasper customer |
| Visualization of Data in the form of charts | No | No | Yes .. using Ad-hoc report output visualization of data in the form of selected charts . |
Readers of this post is encouraged to add your points/suggestions in comment box..
Thank you.
Sadakar
BI developer

Monday, February 16, 2015
Fill Colour of bar s based on a condition in Pentaho CDE
This post will talk about conditional colours of bars with below like scenarios.
Sample Scenario :
Print bar color as red when bar value <=2000
Print bar color as green when bar value >2000 and <10000
Print bar color as black when bar value>=10000
Scenario 2 :
When representing -Ve values on charts .. this kind of representation is preferable.
Code is Taken from Reference links :
function changeBars(){
var cccOptions = this.chartDefinition;
// For changing extension points, a little more work is required:
var eps = Dashboards.propertiesArrayToObject(cccOptions.extensionPoints);
// add extension points:
eps.bar_fillStyle = function getColor(){
var val = this.scene.vars.value.value;
if(val > 0 && val <= 5000){
return red;
}
else if(val > 5000 && val <= 50000){
return green;
}
else{
return black;
}
};
// Serialize back eps into cccOptions
cccOptions.extensionPoints = Dashboards.objectToPropertiesArray(eps);
}
NOTE : I have tried directly in Extension points but it did not work.
Sample output 1 :

function changeBars(){
var cccOptions = this.chartDefinition;
// For changing extension points, a little more work is required:
var eps = Dashboards.propertiesArrayToObject(cccOptions.extensionPoints);
// add extension points:
eps.bar_fillStyle = function getColor(){
var val = this.scene.vars.value.value;
if(val == 26297.2900){
return black;
}
else{
return blue;
}
};
// Serialize back eps into cccOptions
cccOptions.extensionPoints = Dashboards.objectToPropertiesArray(eps);
}

References :
http://translate.google.com/translate?&ie=UTF-8&sl=&tl=en&u=http://www.redopenbi.com/group/ctools/forum/topics/colores-en-bar-chart?commentId=2400100%3AComment%3A103280&xg_source=activity&groupId=2400100%3AGroup%3A73260
OR
http://www.redopenbi.com/group/ctools/forum/topics/colores-en-bar-chart?commentId=2400100%3AComment%3A103280&xg_source=activity&groupId=2400100%3AGroup%3A73260
OR
http://forums.pentaho.com/showthread.php?150582-Bar-chart-colors-dynamically-changed-based-on-data-value-Along-with-JavaScript-vars
Sample Scenario :
Print bar color as red when bar value <=2000
Print bar color as green when bar value >2000 and <10000
Print bar color as black when bar value>=10000
Scenario 2 :
When representing -Ve values on charts .. this kind of representation is preferable.
Code is Taken from Reference links :
function changeBars(){
var cccOptions = this.chartDefinition;
// For changing extension points, a little more work is required:
var eps = Dashboards.propertiesArrayToObject(cccOptions.extensionPoints);
// add extension points:
eps.bar_fillStyle = function getColor(){
var val = this.scene.vars.value.value;
if(val > 0 && val <= 5000){
return red;
}
else if(val > 5000 && val <= 50000){
return green;
}
else{
return black;
}
};
// Serialize back eps into cccOptions
cccOptions.extensionPoints = Dashboards.objectToPropertiesArray(eps);
}
NOTE : I have tried directly in Extension points but it did not work.
Sample output 1 :
Sample output 2 :
function changeBars(){
var cccOptions = this.chartDefinition;
// For changing extension points, a little more work is required:
var eps = Dashboards.propertiesArrayToObject(cccOptions.extensionPoints);
// add extension points:
eps.bar_fillStyle = function getColor(){
var val = this.scene.vars.value.value;
if(val == 26297.2900){
return black;
}
else{
return blue;
}
};
// Serialize back eps into cccOptions
cccOptions.extensionPoints = Dashboards.objectToPropertiesArray(eps);
}
References :
http://translate.google.com/translate?&ie=UTF-8&sl=&tl=en&u=http://www.redopenbi.com/group/ctools/forum/topics/colores-en-bar-chart?commentId=2400100%3AComment%3A103280&xg_source=activity&groupId=2400100%3AGroup%3A73260
OR
http://www.redopenbi.com/group/ctools/forum/topics/colores-en-bar-chart?commentId=2400100%3AComment%3A103280&xg_source=activity&groupId=2400100%3AGroup%3A73260
OR
http://forums.pentaho.com/showthread.php?150582-Bar-chart-colors-dynamically-changed-based-on-data-value-Along-with-JavaScript-vars
Sunday, February 15, 2015
How to do Unlimited Video and Voice Calls on Mobile for Free

Is your increasing phone and sms bill is giving you tension, than don’t be scared. There are so many communication services available on internet which allows you to do unlimited call on mobile for free. In this post I am telling you about some of these services which will help you to get rid of your increasing phone bill. For this you will only need 3G or Wi-Fi data.
Also Read: Top 5 Cheapest Android Tablets below Rs. 5000 in India in 2013
For video calling
FaceTime
http://www.apple.com/in/mac/facetime/
This is a free video calling app of Apple, which works on Wi-Fi. This works very well with second and third generation iPad, iPhone and mac. It is very easy to use.
Tinychat
tinychat.com
It is a browser based chat service. In this you can create a room for chat, for this you have to just do signup. In this room you can invite your friends as a guest. Your friends can chat with you without doing signup process.
For video and voice calling
Nimbuzz
nimbuzz.com
This application works very nicely on smartphones as well as on feature loaded phones. It contains desktop client for windows and mac. To do free chat you have to do free signup in nimbuzz account, after this you can add people to your contacts. You can do free voice calls with the help of 3G or Wi-Fi. It also allows you to do chat with your friends on google talk, yahoo chat, msn and facebook account.
Oovoo
oovoo.com
It provides you video calling services in twelve different ways on your computer or mobile. Its main feature is that it allows you to send files and record your calls.
Also Read: The 12 Best Tools To Protect Your Password
Also Read: The 12 Best Tools To Protect Your Password
Rocketalk
rocketalk.com
You can’t do video chat with the help of this ,but it allows you to send photos, videos and text messages. It is freely available on the internet for all android and java feature loaded phones.
Skype
skype.com
It work on android, IOS, windows and symbian phones. If you have 3G or Wi-Fi than with the help of skype you can do free call to any skype mobile user.
Fring
fring.com
With fring you can do free voice calls, video calls and instant messaging on 3G or Wi-Fi. It provides free four ways group video chat service. It is available for IOS, android and symbian phones.
Viber
viber.com
It is available for android, IOS, windows and blackberry phones. You can do free unlimited call and send messages to a person who have viber installed handset. This works on 3G and Wi-Fi, for this you have to only pay for data.
Friday, February 13, 2015
HowTo Install VirtualBox on Fedora 18 x64
Step1:
- download VirtualBox 4.2.6 for Linux hosts and VirtualBox 4.2.6 Oracle VM VirtualBox Extension Pack on this website https://www.virtualbox.org/wiki/Downloads
- choose the AMD64 architecture for Fedora 18 ("Spherical Cow")
Step2:
- open terminal and type the following
su -
yum update -y
reboot
**your computer will reboot
Step3:
su -
yum install -y dkms gcc
cd /home/**user**/Downloads
yum install -y VirtualBox-4.2-4.2.6_82870_fedora18-1.x86_64.rpm
/etc/init.d/vboxdrv setup
usermod -a -G vboxusers administrator
Step4:
- open a new terminal and type the following
VirtualBox
Step5:
- the Oracle VM VirtualBox Manager will pop-up
- click File->Preferences
- select Extensions
- press the add package button
- find and select Oracle_VM_VirtualBox_Extension_Pack-4.2.6-82870.vbox-extpack
- press Install
- read and understand the VirtualBox licence (click and drag the scrollbar up to the bottom to activate the "I Agree" button)
- supply your root password
- your done!
Read more »
- download VirtualBox 4.2.6 for Linux hosts and VirtualBox 4.2.6 Oracle VM VirtualBox Extension Pack on this website https://www.virtualbox.org/wiki/Downloads
- choose the AMD64 architecture for Fedora 18 ("Spherical Cow")
Step2:
- open terminal and type the following
su -
yum update -y
reboot
**your computer will reboot
Step3:
su -
yum install -y dkms gcc
cd /home/**user**/Downloads
yum install -y VirtualBox-4.2-4.2.6_82870_fedora18-1.x86_64.rpm
/etc/init.d/vboxdrv setup
usermod -a -G vboxusers administrator
Step4:
- open a new terminal and type the following
VirtualBox
Step5:
- the Oracle VM VirtualBox Manager will pop-up
- click File->Preferences
- select Extensions
- press the add package button
- find and select Oracle_VM_VirtualBox_Extension_Pack-4.2.6-82870.vbox-extpack
- press Install
- read and understand the VirtualBox licence (click and drag the scrollbar up to the bottom to activate the "I Agree" button)
- supply your root password
- your done!
C program to read a matrix of size mxn from the keyboard and display the same on the screen
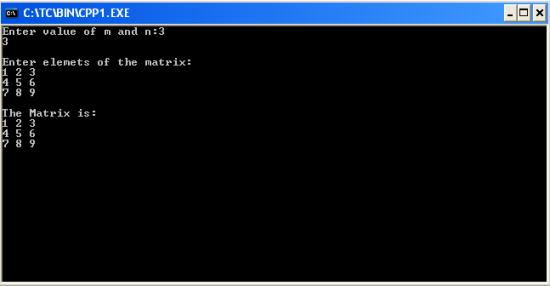
#include<iostream.h>
#include<conio.h>
void main()
{
clrscr(); //to clear the screen
int a[5][5],n,m,i,j;
cout<<"Enter value of m and n:";
cin>>m>>n;
cout<<"
Enter elemets of the matrix:
";
for(i=0;i<m;++i)
for(j=0;j<n;++j)
cin>>a[i][j];
cout<<"
The Matrix is:
";
for(i=0;i<m;++i)
{
for(j=0;j<n;++j)
cout<<a[i][j]<<" ";
cout<<"
";
}
getch(); //to stop the screen
}
Thursday, February 12, 2015
Fetch selected columns from SQL query on Table Component using Penaho CDE
Hi....
A requirement made me to write this post which will talk about fetching few columns on the table component from SQL query.....
Requirement :
Get 5 columns using query in CDA but fetch only 4 columns on the table component...
Fetch columns first column to fifth column excluding 4th column...
Write below code PostFetch of table Component.
function removeColumns(cdaData) {
var valueColIndex = 3;
//var valueColIndex2=2; /*initializing 2nd colum with its index */
//var valueColIndex3=1; /*initializing 1st column with its index */
// Remove metadata column
cdaData.metadata.splice(valueColIndex, 1/*remove count*/);
//cdaData.metadata.splice(valueColIndex2, 1/*remove count*/);
//cdaData.metadata.splice(valueColIndex3, 1/*remove count*/);
// Remove resultset column, from each row
cdaData.resultset.forEach(function(row) {
row.splice(valueColIndex, 1/*remove count*/);
//row.splice(valueColIndex2, 1/*remove count*/);
//row.splice(valueColIndex3, 1/*remove count*/);
});
// Return modified cda data set
return cdaData;
}
Write below code in Pre Execution of Table Component
//Specify the columns which you are removin
function f() {
this.chartDefinition.readers = [
{indexes: 3 /* Value2 */},
//{indexes: 1 /* Value2 */}
//{indexes: 2 /* Value2 */}
];
}
Alternative solution which will reduce writing above code :
Write below code in "Post Execution" of table component. column indexes start from 1 ,2,3 and etc if you write this code.
function myTip()
{
$(th:nth-child(5),td:nth-child(5)).hide(); //hides 5th column
$(th:nth-child(),td:nth-child(10)).hide();//hides 10th column
}
NOTE:
1) Query fields indexes start from 0 and ends with N-1 where N is the number of fields coming from query.
2) You can fetch as many columns from the query result set as you want.
3) See the commented code to remove the other columns...
NOTE that the code in Pre Execution may not accurate but worked fine for the requirement.
Thank you.
References :
1) http://forums.pentaho.com/archive/index.php/t-143075.html
2) http://forums.pentaho.com/showthread.php?143075-specifying-columns-for-pie-chart-in-CDE
3)http://www.webdetails.pt/ctools/charts/jsdoc/symbols/pvc.options.charts.Chart.html#readers
A requirement made me to write this post which will talk about fetching few columns on the table component from SQL query.....
Requirement :
Get 5 columns using query in CDA but fetch only 4 columns on the table component...
Fetch columns first column to fifth column excluding 4th column...
Write below code PostFetch of table Component.
function removeColumns(cdaData) {
var valueColIndex = 3;
//var valueColIndex2=2; /*initializing 2nd colum with its index */
//var valueColIndex3=1; /*initializing 1st column with its index */
// Remove metadata column
cdaData.metadata.splice(valueColIndex, 1/*remove count*/);
//cdaData.metadata.splice(valueColIndex2, 1/*remove count*/);
//cdaData.metadata.splice(valueColIndex3, 1/*remove count*/);
// Remove resultset column, from each row
cdaData.resultset.forEach(function(row) {
row.splice(valueColIndex, 1/*remove count*/);
//row.splice(valueColIndex2, 1/*remove count*/);
//row.splice(valueColIndex3, 1/*remove count*/);
});
// Return modified cda data set
return cdaData;
}
Write below code in Pre Execution of Table Component
//Specify the columns which you are removin
function f() {
this.chartDefinition.readers = [
{indexes: 3 /* Value2 */},
//{indexes: 1 /* Value2 */}
//{indexes: 2 /* Value2 */}
];
}
Alternative solution which will reduce writing above code :
Write below code in "Post Execution" of table component. column indexes start from 1 ,2,3 and etc if you write this code.
function myTip()
{
$(th:nth-child(5),td:nth-child(5)).hide(); //hides 5th column
$(th:nth-child(),td:nth-child(10)).hide();//hides 10th column
}
NOTE:
1) Query fields indexes start from 0 and ends with N-1 where N is the number of fields coming from query.
2) You can fetch as many columns from the query result set as you want.
3) See the commented code to remove the other columns...
NOTE that the code in Pre Execution may not accurate but worked fine for the requirement.
Thank you.
References :
1) http://forums.pentaho.com/archive/index.php/t-143075.html
2) http://forums.pentaho.com/showthread.php?143075-specifying-columns-for-pie-chart-in-CDE
3)http://www.webdetails.pt/ctools/charts/jsdoc/symbols/pvc.options.charts.Chart.html#readers
5 Remarkably Useful WordPress Features You Might Have Missed out on
The herd of CMSes out there is either impressive or interestingly mediocre, but it surely is quite a big and an ever expanding herd that keeps getting crowded by the hour. And Wordpress has remain unscathed till know by purely riding on the consistent self-reinventions and an approach that is unswervingly innovation-driven.
If Wordpress continues on its present trajectory, it is going to be nearly impossible to displace it from its Numero Uno place in the realm of content management systems.

Now, as someone who has been using Wordpress for his/her website from quite a while now, you are probably aware of a truckload of in-built features and the whole ensemble of plugins that Wordpress tosses at you for your consideration. But be it as it may, there is still no dearth of features which still go relatively unnoticed and unheard. And we arent talking about the puny plugins and functionalities that hardly serve a purpose, but certain set of capabilities that Wordpress can vest you up with when you wish to make it seriously count as a web publisher. Here is a bunch of them:
Also Read: How to Find the Websites or Blogs that are Copying your Content?
1. Private Social Circle (To Let the Like-Minded Individuals Within Your Audience Come Under One Roof)
You might pin it on the digitalization of the world, but we, as social animals, manage to make more interpersonal connections over the web than we do in the real, physical world. Its easier to met like-minded people over the Internet and thats what the Private Social Circle feature of Wordpress is aimed to make use of fir boosting the user engagement on your website.
Wordpress offers us the P2 theme that gives your visitors some control over how they engage with your portal. It embeds a feature that facilitates creating user-generated networks wherein every user can stay connected to a bunch of people that share the same interests and tastes.
Lets say, you are running a blog on leisure, entertainment, humor and poetry. Now, you have a huge audience for people who relish the poetry on your site. Imagine how awesome it would be when instead of just commenting (a practise they wont follow repeatedly), your website offers them a platform over which they interact with each other.
Now, they may not be reciting homilies only about your poems and instead they are sharing their own works. What eventually matters is the fact that they are doing so while they are on your website. Every activity happening in that social circle is happening on your domain and this is boosting some metrics like “Total number of visits”, and “Avg. time spent per visit”. Apparently, there are the two stats which matter the most to any webmaster and when P2 makes achieving so effortlessly, there is no reason why you should not grab it right away.
2. SupportDynamo by Plugin Dynamo
This one is the ideal plugin for businesses that are looking to create a Help Desk on their Wordpress websites. Support Dynamo is a high performance plugin that works in perfect unison with most Wordpress themes. It facilitates email piping (a feature much in demand off-late), helps you create a knowledge base on the site for your audience to refer, integrates the method of signing up for membership, helps save comments and replies, simplifies the process of creating user ticket notes, etc.
Also Read: Pros and Cons of Interviewing Bloggers on your Blog
3. Wordpress Wiki
User generated content has always been a trump card for smart publishers. For bloggers who scramble to update the content on their blog frequently, the Wordpress Wiki is a gift. Facilitating an interface that is user-friendly and lets your visitors update the posts on your website (aka Wikipedia) and also submit their own, Wordpress Wiki makes sure you are never short of content and that your visitors have one more reason to stay around: they have a better interface than an unnoticeable comment box below the posts to voice their opinions about a certain post. Of course, the challenge for you is to audit the content comprehensively and with a lot of care to ensure that no inappropriate language or controversial phrases make their way to the live posts.
4. Comment Redirect
When increasing the average time spent per visit and boosting the overall engagement is on your agenda, Comment Redirect is among the very best things you can get your hands on. When a visitor on your website is commenting on a post, most likely, they have found that piece of content engaging enough (even if they dont particularly like it), so it wont be a bad idea to engage them a little more. Comment Redirect lets you redirect your sites visitors on a page of your choice as soon as they hit the Submit button under the comments section. Now that page may just just be another post or it can be the page suggesting the comment to sign up as a subscriber to your site or any of the zillion other things you want them to do.
5. WP Mingle Plugin
Close on the heels of the Private Social Circle, but one with the scope of creating more unexclusive circles. The WP Mingle plugin transforms your website into a social media portal that gives your visitors the wherewithal to facilitate social media activities like tagging friends to the posts, uploading personalized avatars, private messaging within the websites circle, posting their own content and much more. This plugin thus gives your websites traffic a major push in the terms of quantity and the quality visits.
The adaptability of Wordpress to the rapidly changing digital environment is what serves as its differentiator, and also the fact that it has not just remained glued to trends, but has also been the sole proprieter of certain trends that have altered the whole landscape of Internet.
Author Bio
Maria is an expert in web technologies and loves to dole out sermon around the same. She works for Wordprax, a HTML to Wordpress Service company. If you plan to hire services for Convert Magento to Wordpress , you can count on Wordprax.
6 FAQs on Graphic Designing as a Career

Who doesn’t want to ‘make it big’ in life and rise to the zenith by dint of his enviable career? Of course, there’s no shortcut to success. However, a few smart career moves can lead you to a greener pasture. For example, if you have a creative mind, and believe in teamwork and wish to pursue an ‘offbeat’ career that can offer you a secured future, then you might consider giving graphic designing a try.
Also Read: The Top 10 Websites to create free Logo for your Blog
Also Read: How to Choose the Right Theme for Your Blog?
Here are the FAQs on graphic designing as a vocation:
Q#1: What does a graphic designer do?
By and large, graphic designers are employed to develop designs foe product illustrations, marketing collateral, websites that use computer software and brand identities. They are expected to combine their technical skills with their creativity, and create designs that communicate with the targeted audiences. A graphic designer might work independently, or get placed at different companies.
Q#2: Do you need to pursue any vocational course to become a graphic designer?
To become an expert graphic designer, you need to familiarize yourself with software applications like Adobe Photoshop, Adobe InDesign, Adobe Illustrator, Adobe PageMaker, Corel Draw and the like. A number of agencies offer courses, which are customized to help aspiring graphic designers to proceed in their career. However, it doesn’t take much time to complete the courses, and the course fee is generally kept minimal. After completing the course from a reputed institution, you can earn a living for yourself.
Q#3: Which company to choose?
Since there has been a mushroom growth of institutions offering web designing courses, you might wonder about the ‘right’ institution to join. Ideally, look for an institution which:
- Has been providing web designing course for long.
- Trains you to overcome any professional hazards in the long run.
- Provide in depth knowledge in the skills-in-demand
- Employs experts in the field to train the students.
- Helps in placement after the course is over.

Q#4: Will this profession suit you?
It takes more than technical expertise and a creative bend of mind to become a graphic designer. You need to acquire some soft skills as well. Such as:
- You need to be a stickler for perfection.
- You need to be diligent and ever eager to learn new things.
- You need to be open to suggestions and criticisms.
- You should be able to meet the deadline and deliver the work as and when needed.
Q#5: How to gain experience in this field?
It’s imperative to gain experience to build your confidence and hone your designing skills. This will help establish your reputation as an expert over time. To acquire experience, consider:
- Volunteer your services to any non-profit organization or a local school.
- Helping a family friend/relative by designing their wedding invitation cards.
- Designing your own greeting cards.
- Selling your creations in the local stores.
Also Read: Top 5 Tools to Create Interesting Infographic
Also Read: Top IT Certification Programs for Beginners in 2014
Q#6: How much salary to expect?
As a beginner, you might expect getting around 8500 INR per month. With some experience, you might be able to earn around 20,000 INR. The following factors might affect your salary, though:
- The projects you have undertaken
- Your job location
- The size of the company/design firm you work for.
- Your career responsibilities.
Q#6: Where can you find institutions that offer graphic designing courses?
You might find institutions offering graphic designing courses in almost all the major cities in India. There are a number of institutions are offering graphic design courses in Kolkata. And if you live in the outskirts, then you can also avail graphic designing courses in Rishra, Serampur- they are close to many locations.
Will you like to build your career as a graphic designer? If yes, then start looking for an institution offering graphic designing courses without much ado.
Author Bio:
Henry Carter is associated with a Web development company. He is specialised in Flash web design and database driven e-commerce. Recently he has started writing on Web development and web designing related content and likes to share his experience with his readers. Also he runs his own institute to offer graphic design courses, with an intention to provide more scope of employment.
Wednesday, February 11, 2015
C program to read a matrix of size mxn and display it on the screen

#include<stdio.h>
#include<conio.h>
void main()
{
int a[5][5],n,m,i,j;
clrscr();
printf("Enter value of m and n: ");
scanf("%d%d",&m,&n);
printf("
Enter elemets of the matrix:
");
for(i=0;i<m;++i)
for(j=0;j<n;++j)
scanf("%d",&a[i][j]);
printf("
The Matrix is:
");
for(i=0;i<m;++i)
{
for(j=0;j<n;++j)
printf("%d ",a[i][j]);
printf("
");
}
getch();
}
Thursday, February 5, 2015
How to share presentations on LinkedIn
 Image via CrunchBase
There are two ways to share your presentations on Linkedin; 1) Using SlideShare 2) Google Presentations. In order to share presentations either via SlideShare or Google presentations you need to install SlideShare or Google presentations application. To add a presentation to your Linkedin profile, follow the steps below:
 1. First sign in to your Linkedin account
2. Either go to Edit My Profile and add an application from there or click Add an
Application box on the right.
3. In the Applications section, click Add an
Application and select Google or Slideshare
Presentation.
You need to have a SlideShare or Google account to use respective applications. Login to your SlideShare/Google account to link your SlideShare/Google account with your Linkedin profile.These Linkedin applications not only let you share your presentations with your connections but also let you see what people in your network are sharing, viewing and commenting.
Google presentations Linkedin App
Though you can upload and share a new presentation from your desktop or share an existing presentation in your Google account yet you still have to go to Google docs to create a new presentations.
SlideShare Linkedin App
Slideshare app lets you share all presentations from your Linkedin account or upload and share new presentations from within Linkedin. SlideShare has recently released Linkedin share button as well which means now you can share any SlideShare presentation on LinkedIn with a press of button.
2. Either go to Edit My Profile and add an application from there or click Add an
Application box on the right.
3. In the Applications section, click Add an
Application and select Google or Slideshare
Presentation.
You need to have a SlideShare or Google account to use respective applications. Login to your SlideShare/Google account to link your SlideShare/Google account with your Linkedin profile.These Linkedin applications not only let you share your presentations with your connections but also let you see what people in your network are sharing, viewing and commenting.
Google presentations Linkedin App
Though you can upload and share a new presentation from your desktop or share an existing presentation in your Google account yet you still have to go to Google docs to create a new presentations.
SlideShare Linkedin App
Slideshare app lets you share all presentations from your Linkedin account or upload and share new presentations from within Linkedin. SlideShare has recently released Linkedin share button as well which means now you can share any SlideShare presentation on LinkedIn with a press of button.

Tuesday, February 3, 2015
Maxing out at 50 concurrent connections with Play or Netty on OS X Heres a fix
I recently ran across a strange problem with the Play Framework and Netty: on Linux, my Play app could easily handle thousands of concurrent connections; on OS X, the same app maxed out at around 50 concurrent connections. It took a while to figure out the problem, so in this post, Im documenting the solution in case other folks run into the same issue in the future. Note: if youre using raw Netty, the fix is very straightforward; if youre using Play, its much trickier, and I hope it will be fixed in Play itself in the near future.
tldr: set the backlog option on Nettys Bootstrap object to a higher value (example).
Symptoms
On OS X, your Play or Netty app cannot handle more than ~50 concurrent connections. A simple way to test this is to use Apache Bench:
As soon as you set the concurrency level (the -c parameter) above 50, youll get the error "apr_socket_recv: Connection reset by peer (54)". Moreover, your Play or Netty app will never actually see the request and nothing will show up in the logs.
However, if you run the same experiment against the same app running on Linux, even with the concurrency level set to several hundred or several thousand, all requests will complete successfully, without errors. Therefore, there must be something OS specific causing this problem.
To be fair, its rare to use OS X in any production or high traffic capacity - for example, at LinkedIn, we use OS X in dev, but Linux in prod - so the concurrency limitation is rarely a problem. However, we had a few use cases where, even in dev mode, we had to make many concurrent calls to the same app, so we had to find a solution.
The Cause
It turns out that "50" is the default size for the "backlog" parameter in Javas ServerSocket. It is even explained in the JavaDoc:
The Solution (pure Netty)
After some more digging, this StackOverflow thread reveals that the Netty ServerBootstrap class lets you set an option to override the backlog:
If youre using pure netty, just use the code above and the 50 concurrent connections limit will vanish immediately!
Also worth noting: this issue exists in Netty 3.x, but apparently Netty 4.x sets a better default than 50 on all OSs, so upgrading Netty versions may be another solution.
The Solution (Play)
Play instantiates the ServerBootstrap class inside of NettyServer.scala. Unfortunately, neither the class nor the boostrap instance inside of it are accessible to app code. This should be easy to fix via a pull request, but until that happens, and until a new version is available, here is a two part workaround to get moving.
Note: this is an ugly hack with lots of copy/paste from the original Play source code and is only meant as a temporary workaround. It has been tested with Play 2.2.1; figure out which version of Play youre on and be sure to use code from that release!
Step 1: make a local copy of NettyServer.scala called TempNettyServer.scala
Youll want to put TempNettyServer.scala in a different SBT project than your normal app code - that is, dont just put it in the app folder. See SBT Multi-Project Builds for more info.
The folder structure looks something like this: my-app is my original Play app and monkey-patch is a new SBT project for TempNettyServer.scala:
Copy the contents of the original NettyServer.scala into TempNettyServer.scala, with two changes:
Now, configure this new SBT project in project/Build.scala:
Step 2: override the run and start commands to use TempNettyServer
Ready for more copy/paste?
Grab PlayRun.scala and copy it into the project folder under some other name, such as TempPlayRun.scala and make two changes:
A note on OS limits
After making the changes above, you should be able to handle more than 50 concurrent connections. However, depending on how your OS is configured, you might still hit a limit at 128 or so. This is probably due to the kernel config kern.ipc.somaxconn, which controls "the size of the listen queue for accepting new TCP connections" and has a default of 128.
To tweak this limit, you can run the following command:
Your Netty or Play app should now be able to handle over 1000 concurrent connections (or more, depending on what limits you set above).
Read more »
tldr: set the backlog option on Nettys Bootstrap object to a higher value (example).
Symptoms
On OS X, your Play or Netty app cannot handle more than ~50 concurrent connections. A simple way to test this is to use Apache Bench:
As soon as you set the concurrency level (the -c parameter) above 50, youll get the error "apr_socket_recv: Connection reset by peer (54)". Moreover, your Play or Netty app will never actually see the request and nothing will show up in the logs.
However, if you run the same experiment against the same app running on Linux, even with the concurrency level set to several hundred or several thousand, all requests will complete successfully, without errors. Therefore, there must be something OS specific causing this problem.
To be fair, its rare to use OS X in any production or high traffic capacity - for example, at LinkedIn, we use OS X in dev, but Linux in prod - so the concurrency limitation is rarely a problem. However, we had a few use cases where, even in dev mode, we had to make many concurrent calls to the same app, so we had to find a solution.
The Cause
It turns out that "50" is the default size for the "backlog" parameter in Javas ServerSocket. It is even explained in the JavaDoc:
The maximum queue length for incoming connection indications (a request to connect) is set to 50. If a connection indication arrives when the queue is full, the connection is refused.Therefore, whatever code manages sockets in Netty must use different configurations for the backlog parameter on Linux and OS X. This code is likely tied to the selector implementation for the OS: Im guessing the Linux version uses epoll, while OS X uses kqueue. The former probably sets backlog to some reasonable value (perhaps from OS settings) while the latter just uses the default (which is 50).
The Solution (pure Netty)
After some more digging, this StackOverflow thread reveals that the Netty ServerBootstrap class lets you set an option to override the backlog:
If youre using pure netty, just use the code above and the 50 concurrent connections limit will vanish immediately!
Also worth noting: this issue exists in Netty 3.x, but apparently Netty 4.x sets a better default than 50 on all OSs, so upgrading Netty versions may be another solution.
The Solution (Play)
Play instantiates the ServerBootstrap class inside of NettyServer.scala. Unfortunately, neither the class nor the boostrap instance inside of it are accessible to app code. This should be easy to fix via a pull request, but until that happens, and until a new version is available, here is a two part workaround to get moving.
Note: this is an ugly hack with lots of copy/paste from the original Play source code and is only meant as a temporary workaround. It has been tested with Play 2.2.1; figure out which version of Play youre on and be sure to use code from that release!
Step 1: make a local copy of NettyServer.scala called TempNettyServer.scala
Youll want to put TempNettyServer.scala in a different SBT project than your normal app code - that is, dont just put it in the app folder. See SBT Multi-Project Builds for more info.
The folder structure looks something like this: my-app is my original Play app and monkey-patch is a new SBT project for TempNettyServer.scala:
Copy the contents of the original NettyServer.scala into TempNettyServer.scala, with two changes:
- Replace all NettyServer references to TempNettyServer
- In the newBootstrap method, make the change below to allow configuring the backlog option
Now, configure this new SBT project in project/Build.scala:
Step 2: override the run and start commands to use TempNettyServer
Ready for more copy/paste?
Grab PlayRun.scala and copy it into the project folder under some other name, such as TempPlayRun.scala and make two changes:
- Replace all PlayRun references with TempPlayRun: there should only be one, which is the class name.
- Replace all NettyServer references with TempNettyServer: there should two, both in String literals, used in the "run" and "start" commands to fire up the app.
A note on OS limits
After making the changes above, you should be able to handle more than 50 concurrent connections. However, depending on how your OS is configured, you might still hit a limit at 128 or so. This is probably due to the kernel config kern.ipc.somaxconn, which controls "the size of the listen queue for accepting new TCP connections" and has a default of 128.
To tweak this limit, you can run the following command:
Your Netty or Play app should now be able to handle over 1000 concurrent connections (or more, depending on what limits you set above).
Subscribe to:
Posts (Atom)